블로그 이미지
LifeisSimple

calendar

1 2 3 4 5 6
7 8 9 10 11 12 13
14 15 16 17 18 19 20
21 22 23 24 25 26 27
28 29 30

Notice

2017. 3. 20. 11:39 Brain Trainning/DataBase

출처 : https://blogs.msdn.microsoft.com/psssql/2016/10/04/default-auto-statistics-update-threshold-change-for-sql-server-2016/

Default auto statistics update threshold change for SQL Server 2016


Lately, we had a customer who contacted us for a performance issue where their server performed much worse in SQL Server 2016 following upgrade.  To show us as an example, he even captured a video.  In the video, he showed that the session that was compiling the query had multiple threads waiting on LATCH_EX of ACCESS_METHODS_DATASET_PARENT.  This type of latch is used to synchronize dataset access among parallel threads.  In general, it deals with large amount of data.   Below is a screenshot from the video. Note that I didn’t include complete columns because I don’t want to reveal customer’s database and user names.   This is very puzzling because we should not see parallel threads during true phases of compiling.


image


After staring at it for a moment, we started to realize that this must have something to do with auto update statistics.  Fortunately, we have a copy of pssdiag captured that include trace data.  To prove that auto update statistics could have caused the issue, we needed to find some evidence of long running auto update stats event.  After importing the data, we were able to find some auto update stats took more than 2 minutes.  These stats update occurred to the queries customer pointed out.  Below is an example of auto update in profiler trace extracted from customer’s data collection.


image


Root cause & SQL Server 2016 change

This turned out to be the default auto stats threshold change in SQL 2016.

KB Controlling Autostat (AUTO_UPDATE_STATISTICS) behavior in SQL Server documents two thresholds.  I will call them old threshold and new threshold.

Old threshold: it takes 20% of row changes before auto update stats kicks (there are some tweaks for small tables, for large tables, 20% change is needed).  For a table with 100 million rows, it requires 20 million row change for auto stats to kick in. For vast majority of large tables, auto stats basically doesn’t do much.

New threshold: Starting SQL 2008 R2 SP1, we introduced a trace flag 2371 to control auto update statistics better (new threshold).  Under trace flag 2371, percentage of changes requires is dramatically reduced with large tables.  In other words, trace flag 2371 can cause more frequent update.  This new threshold is off by default and is enabled by the trace flag.  But in SQL 2016, this new threshold is enabled by default for a database with compatibility level 130.

In short:

SQL Server 2014 or below: default is the old threshold.  You can use trace flag 2371 to activate new threshold

SQL Server 2016:  Default is new threshold if database compatibility level is 130.  If database compatibility  is below 130, old threshold is used (unless you use trace flag 2371)

Customer very frequently ‘merge’ data into some big tables. some of them had 300 million rows.  The process triggered much more frequent stats update now because of the threshold change for the large tables.  


Solution

The solution is to enable asynchronous statistics update.  After customer implemented this approach, their server performance went back to old level.


image


Demo of auto stats threshold change


–setup a table and insert 100 million rows
drop database testautostats
go
create database testautostats
go
use testautostats
go
create table t (c1 int)
go
set nocount on
declare @i int
set @i = 0
begin tran
while @i < 100000000
begin
declare @rand int = rand() * 1000000000
    if (@i % 100000 = 0)
    begin
        while @@trancount > 0     commit tran
        begin tran
    end
    insert into t values (@rand)
    set @i  = @i + 1
end
commit tran

go
create index ix on t (c1)
go


–run this query and query stats property 
–note the last_updated column
select count (*) from t join sys.objects o on t.c1=o.object_id
go
select * from sys.stats st cross apply sys.dm_db_stats_properties (object_id, stats_id) 
where st.object_id = object_id (‘t’)

image


–delete 1 million row
–run the same query and query stats property
–note that last_updated column changed
delete top (1000000) from t
go
select count (*) from t join sys.objects o on t.c1=o.object_id

go
select * from sys.stats st cross apply sys.dm_db_stats_properties (object_id, stats_id) 
where st.object_id = object_id (‘t’)


image


–now switch DB compt level to 120
–delete 1 million row
–note that stats wasn’t updated (last_updated column stays the same)
alter database testautostats SET COMPATIBILITY_LEVEL=120
go
delete top (1000000) from t
go
select * from sys.stats st cross apply sys.dm_db_stats_properties (object_id, stats_id) 
where st.object_id = object_id (‘t’)


image


추가 : http://www.sqlservergeeks.com/sql-server-trace-flag-2371-to-control-auto-update-statistics-threshold-and-behavior-in-sql-server/


posted by LifeisSimple
2016. 7. 6. 16:17 Brain Trainning/DataBase

Understanding how SQL Server stores data in data files


By:    |   Read Comments   |   Related Tips: More > Database Administration


출처 : https://www.mssqltips.com/sqlservertip/4345/understanding-how-sql-server-stores-data-in-data-files/


Problem

Have you ever thought about how SQL Server stores data in its data files? As you know, data in tables is stored in row and column format at the logical level, but physically it stores data in data pages which are allocated from the data files of the database. In this tip I will show how pages are allocated to data files and what happens when there are multiple data files for a SQL Server database. 

Solution

Every SQL Server database has at least two operating system files: a data file and a log file. Data files can be of two types: Primary or Secondary.  The Primary data file contains startup information for the database and points to other files in the database. User data and objects can be stored in this file and every database has one primary data file. Secondary data files are optional and can be used to spread data across multiple files/disks by putting each file on a different disk drive. SQL Server databases can have multiple data and log files, but only one primary data file. Above these operating system files, there are Filegroups. Filegroups work as a logical container for the data files and a filegroup can have multiple data files.

The disk space allocated to a data file is logically divided into pages which is the fundamental unit of data storage in SQL Server. A database page is an 8 KB chunk of data. When you insert any data into a SQL Server database, it saves the data to a series of 8 KB pages inside the data file. If multiple data files exist within a filegroup, SQL Server allocates pages to all data files based on a round-robin mechanism. So if we insert data into a table, SQL Server allocates pages first to data file 1, then allocates to data file 2, and so on, then back to data file 1 again. SQL Server achieves this by an algorithm known as Proportional Fill.

The proportional fill algorithm is used when allocating pages, so all data files allocate space around the same time. This algorithm determines the amount of information that should be written to each of the data files in a multi-file filegroup based on the proportion of free space within each file, which allows the files to become full at approximately the same time. Proportional fill works based on the free space within a file.

Analyzing How SQL Server Data is Stored

Step 1: First we will create a database named "Manvendra" with three data files (1 primary and 2 secondary data files) and one log file by running the below T-SQL code. You can change the name of the database, file path, file names, size and file growth according to your needs.

CREATE DATABASE [Manvendra]
 CONTAINMENT = NONE
 ON  PRIMARY
( NAME = N'Manvendra', FILENAME = N'C:\MSSQL\DATA\Manvendra.mdf',SIZE = 5MB , MAXSIZE = UNLIMITED, FILEGROWTH = 10MB ),
( NAME = N'Manvendra_1', FILENAME = N'C:\MSSQL\DATA\Manvendra_1.ndf',SIZE = 5MB , MAXSIZE = UNLIMITED, FILEGROWTH = 10MB ),
( NAME = N'Manvendra_2', FILENAME = N'C:\MSSQL\DATA\Manvendra_2.ndf' ,SIZE = 5MB , MAXSIZE = UNLIMITED, FILEGROWTH = 10MB )
 LOG ON
( NAME = N'Manvendra_log', FILENAME = N'C:\MSSQL\DATA\Manvendra_log.ldf',SIZE = 10MB , MAXSIZE = 1GB , FILEGROWTH = 10%)
GO

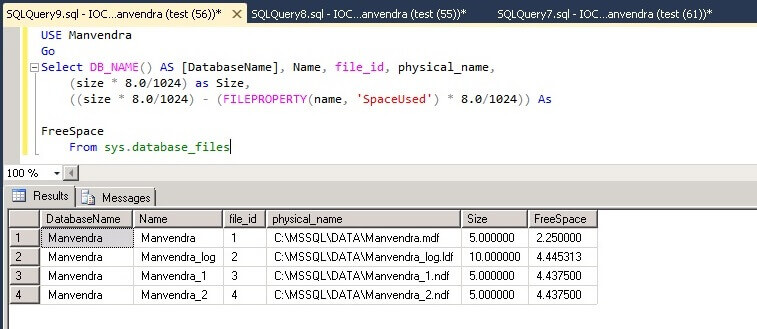
Step 2: Now we can check the available free space in each data file of this database to track the sequence of page allocations to the data files. There are multiple ways to check such information and below is one option. Run the below command to check free space in each data file.

USE Manvendra
GO
Select DB_NAME() AS [DatabaseName], Name, file_id, physical_name,
    (size * 8.0/1024) as Size,
    ((size * 8.0/1024) - (FILEPROPERTY(name, 'SpaceUsed') * 8.0/1024)) As FreeSpace
    From sys.database_files

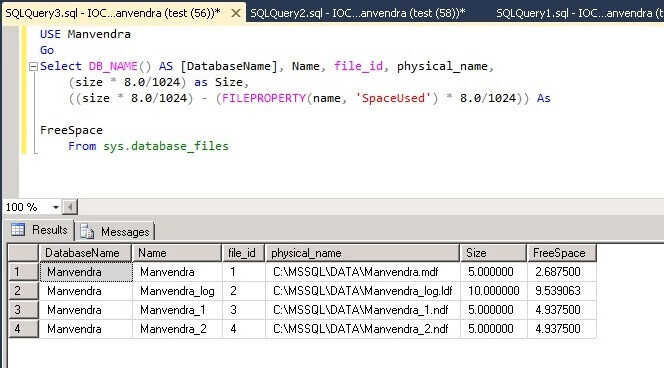
You can see the data file names, file IDs, physical name, total size and available free space in each of the database files.

data file free spaces post SQL Server database creation

We can also check how many Extents are allocated for this database. We will run the below DBCC command to get this information. Although this is undocumented DBCC command this can be very useful information.

USE Manvendra
GO
DBCC showfilestats

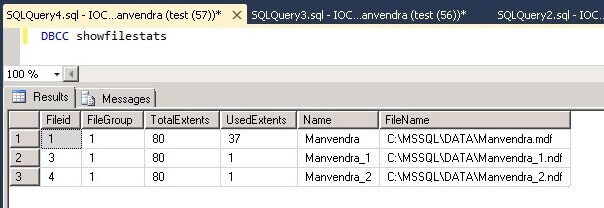
With this command we can see the number of Extents for each data file. As you may know, the size of each data page is 8KB and eight continuous pages equals one extent, so the size of an extent would be approximately 64KB. We created each data file with a size of 5 MB, so the total number of available extents would be 80 which is shown in column TotalExtents, we can get this by (5*1024)/64.

UsedExtents is the number of extents allocated with data. As I mentioned above, the primary data file includes system information about the database, so this is why this file has a higher number of UsedExtents.

used extents post SQL Server database creation

Step 3: The next step is to create a table in which we will insert data. Run the below command to create a table. Once the table is created we will run both commands again which we ran in step 2 to get the details of free space and used/allocated extents.

USE Manvendra;
GO
CREATE TABLE [Test_Data] (
    [Sr.No] INT IDENTITY,
    [Date] DATETIME DEFAULT GETDATE (),
    [City] CHAR (25) DEFAULT 'Bangalore',
 [Name] CHAR (25) DEFAULT 'Manvendra Deo Singh');

Step 4: Check the allocated pages and free space available in each data file by running same commands from step 2. 

USE Manvendra
Go
Select DB_NAME() AS [DatabaseName], Name, file_id, physical_name,
    (size * 8.0/1024) as Size,
    ((size * 8.0/1024) - (FILEPROPERTY(name, 'SpaceUsed') * 8.0/1024)) As FreeSpace
    From sys.database_files

You can see that there is no difference between this screenshot and the above screenshot except for a little difference in the FreeSpace for the transaction log file.

SQL Server databas file space post table creation

Now run the below DBCC command to check the allocated pages for each data file.

DBCC showfilestats

You can see the allocated pages of each data files has not changed.

used extents post SQL Server table creation

Step 5: Now we will insert some data into this table to fill each of the data files. Run the below command to insert 10,000 rows to table Test_Data.

USE Manvendra
go
INSERT INTO Test_DATA DEFAULT VALUES;
GO 10000

Step 6: Once data is inserted we will check the available free space in each data file and the total allocated pages of each data file.

USE Manvendra
Go
Select DB_NAME() AS [DatabaseName], Name, file_id, physical_name,
    (size * 8.0/1024) as Size,
    ((size * 8.0/1024) - (FILEPROPERTY(name, 'SpaceUsed') * 8.0/1024)) As FreeSpace
    From sys.database_files

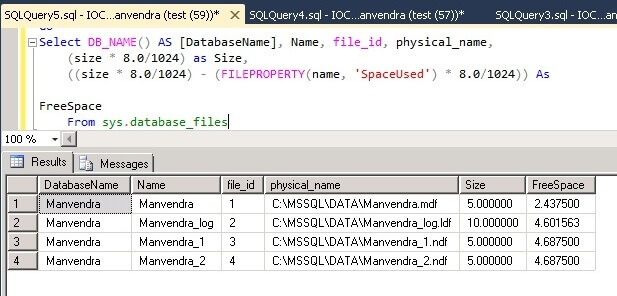
You can see the difference between the screenshot below and the above screenshot. Free space in each data file has been reduced and the same amount of space has been allocated from both of the secondary data files, because both files have the same amount of free space and proportional fill works based on the free space within a file. 

SQL Server Database File space post data insert

Now run below DBCC command to check the allocated pages for each data files.

DBCC showfilestats

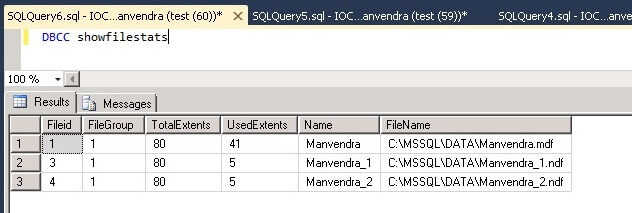
You can see a few more pages have been allocated for each data file. Now the primary data file has 41 extents and the secondary data files have a total of 10 extents, so total data saved so far is 51 extents. Both secondary data files have the same number of extents allocated which proves the proportional fill algorithm.

used extents post SQL Server data insert

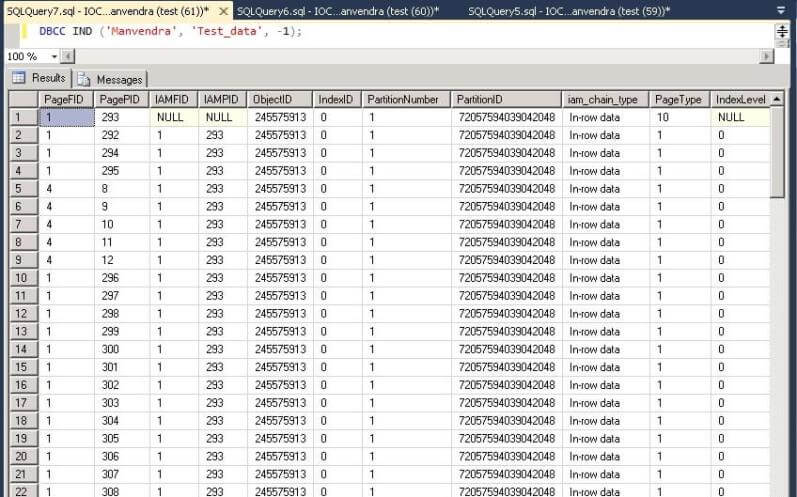
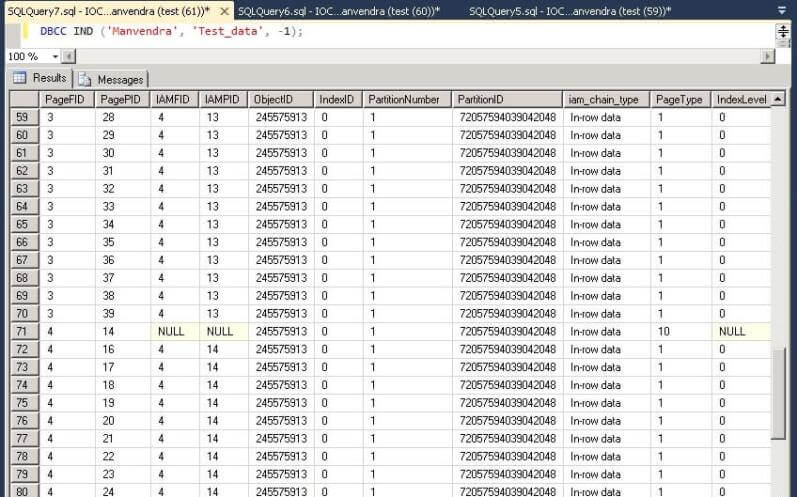
Step 7: We can also see where data is stored for table "Test_Data" for each data file by running the below DBCC command. This will let us know that data is stored on all data files.

DBCC IND ('Manvendra', 'Test_data', -1);

I attached two screenshots because the number of rows was very large to show all data file IDs where data has been stored. File IDs are shown in each screenshot, so we can see each data page and their respective file ID. From this we can say that table Test_data is saved on all three data files as shown in the following screenshots.

SQL Server data table saved on which data files


Data table saved on particular SQL Server data files

Step 8: We will repeat the same exercise again to check space allocation for each data file. Insert an additional 10,000 rows to the same table Test_Data to check and validate the page allocation for each data file. Run the same command which we ran in step 5 to insert 10,000 more rows to the table test_data. Once the rows have been inserted, check the free space and allocated extents for each data file.

USE Manvendra
GO
INSERT INTO Test_DATA DEFAULT VALUES;
GO 10000
Select DB_NAME() AS [DatabaseName], Name, file_id, physical_name,
    (size * 8.0/1024) as Size,
    ((size * 8.0/1024) - (FILEPROPERTY(name, 'SpaceUsed') * 8.0/1024)) As FreeSpace
    From sys.database_files

We can see again both secondary data files have the same amount of free space and similar amount of space has been allocated from the primary data file as well. This means SQL Server uses a proportional fill algorithm to fill data in to the data files.

SQL Server database file space post data insert

We can get the extent information again for the data files.

DBCC showfilestats

Again we can see in increase in the UsedExtents for all three of the data files.

used extents post SQL Server data insert
Next Steps
  • Create a test database and follow these steps, so you can better understand how SQL Server stores data at a physical and logical level. 
  • Explore more knowledge with SQL Server Database Administration Tips


posted by LifeisSimple
2016. 6. 22. 09:57 Brain Trainning/DataBase


Graphing MySQL performance with Prometheus and Grafana


출처 : https://www.percona.com/blog/2016/02/29/graphing-mysql-performance-with-prometheus-and-grafana/


   | February 29, 2016 |  Posted In: MonitoringMySQLPrometheus

This post explains how you can quickly start using such trending tools as Prometheus and Grafana for monitoring and graphing of MySQL and system performance.

First of all, let me mention that Percona Monitoring and Management beta has been released recently which is an easy way you can get all of this.

I will try to keep this blog as short as possible, so you can quickly set things up before getting bored. I plan to cover the details in the next few posts. I am going to go through the installation process here in order to get some really useful and good-looking graphs in the end.

Overview

PrometheusPrometheus is an open-source service monitoring system and time series database. In short, the quite efficient daemon scrapes metrics from remote machines using HTTP protocol and stores data in the local time-series database. Prometheus provides a simple web interface, a very powerful query language, HTTP API etc. However, the storage is not designed to be durable for the time being.

The remote machines need to run exporters to expose metrics to Prometheus. We will be using the following two:

GrafanaGrafana is an open source, feature-rich metrics dashboard and graph editor for Graphite, Elasticsearch, OpenTSDB, Prometheus and InfluxDB. It is a powerful tool for visualizing large-scale measurement data and designed to work with time-series. Grafana supports different types of graphs, allows for custom representation of individual metrics on the graph and various methods of authentication including LDAP.

Diagram

Here is a diagram of the setup we are going to use:
Prometheus + Grafana diagram

Prometheus setup

To install on the monitor host.

Get the latest tarball from Github.

Create a simple config:

where 192.168.56.107 is the IP address of the db host we are going to monitor and db1 is its short name. Note, the “alias” label is important here because we rely on it in the predefined dashboards below to get per host graphs.

Start Prometheus in foreground:

Now we can access Prometheus’ built-in web interface by http://monitor_host:9090

Prometheus web interface
If you look at the Status page from the top menu, you will see that our monitoring targets are down so far. Now let’s setup them – prometheus exporters.

Prometheus exporters setup

Install on the db host. Of course, you can use the same monitor host for the experiment. Obviously, this node must run MySQL.

Download exporters from here and there.

Start node_exporter in foreground:

Unlike node_exporter, mysqld_exporter wants MySQL credentials. Those privileges should be sufficient:

Create .my.cnf and start mysqld_exporter in foreground:

At this point we should see our endpoints are up and running on the Prometheus Status page:
Prometheus status page

Grafana setup

Install on the monitor host.

Grafana has RPM and DEB packages. The installation is as simple as installing one package.
RPM-based system:

or APT-based one:

Open and edit the last section of /etc/grafana/grafana.ini resulting in the following ending:

Percona has built the predefined dashboards for Grafana with Prometheus for you.

Let’s get them deployed:

It is important to apply the following minor patch on Grafana 2.6 in order to use the interval template variable to get the good zoomable graphs. The fix is simply to allow variable in Step field on Grafana graph editor page. For more information, take a look at PR#3757 and PR#4257. We hope the last one will be released with the next Grafana version.

Those changes are idempotent.

Finally, start Grafana:

At this point, we are one step before being done. Login into Grafana web interface http://monitor_host:3000 (admin/admin).

Go to Data Sources and add one for Prometheus:
Grafana datasource

Now check out the dashboards and graphs. Say choose “System Overview” and period “Last 5 minutes” on top-right. You should see something similar:
Grafana screen
If your graphs are not populating ensure the system time is correct on the monitor host.

Samples

Here are some real-world samples (images are clickable and scrollable):


Enjoy!

Conclusion

Prometheus and Grafana is a great tandem for enabling monitoring and graphing capabilities for MySQL. The tools are pretty easy to deploy, they are designed for time series with high efficiency in mind. In the next blog posts I will talk more about technical aspects, problems and related stuff.


posted by LifeisSimple
2016. 6. 6. 23:22 Brain Trainning/DataBase


Graphing MySQL performance with Prometheus and Grafana

   | February 29, 2016 |  Posted In: MonitoringMySQLPrometheus

출처 : https://www.percona.com/blog/2016/02/29/graphing-mysql-performance-with-prometheus-and-grafana/

This post explains how you can quickly start using such trending tools as Prometheus and Grafana for monitoring and graphing of MySQL and system performance.

First of all, let me mention that Percona Monitoring and Management beta has been released recently which is an easy way you can get all of this.

I will try to keep this blog as short as possible, so you can quickly set things up before getting bored. I plan to cover the details in the next few posts. I am going to go through the installation process here in order to get some really useful and good-looking graphs in the end.

Overview

PrometheusPrometheus is an open-source service monitoring system and time series database. In short, the quite efficient daemon scrapes metrics from remote machines using HTTP protocol and stores data in the local time-series database. Prometheus provides a simple web interface, a very powerful query language, HTTP API etc. However, the storage is not designed to be durable for the time being.

The remote machines need to run exporters to expose metrics to Prometheus. We will be using the following two:

GrafanaGrafana is an open source, feature-rich metrics dashboard and graph editor for Graphite, Elasticsearch, OpenTSDB, Prometheus and InfluxDB. It is a powerful tool for visualizing large-scale measurement data and designed to work with time-series. Grafana supports different types of graphs, allows for custom representation of individual metrics on the graph and various methods of authentication including LDAP.

Diagram

Here is a diagram of the setup we are going to use:
Prometheus + Grafana diagram

Prometheus setup

To install on the monitor host.

Get the latest tarball from Github.

Create a simple config:

where 192.168.56.107 is the IP address of the db host we are going to monitor and db1 is its short name. Note, the “alias” label is important here because we rely on it in the predefined dashboards below to get per host graphs.

Start Prometheus in foreground:

Now we can access Prometheus’ built-in web interface by http://monitor_host:9090

Prometheus web interface
If you look at the Status page from the top menu, you will see that our monitoring targets are down so far. Now let’s setup them – prometheus exporters.

Prometheus exporters setup

Install on the db host. Of course, you can use the same monitor host for the experiment. Obviously, this node must run MySQL.

Download exporters from here and there.

Start node_exporter in foreground:

Unlike node_exporter, mysqld_exporter wants MySQL credentials. Those privileges should be sufficient:

Create .my.cnf and start mysqld_exporter in foreground:

At this point we should see our endpoints are up and running on the Prometheus Status page:
Prometheus status page

Grafana setup

Install on the monitor host.

Grafana has RPM and DEB packages. The installation is as simple as installing one package.
RPM-based system:

or APT-based one:

Open and edit the last section of /etc/grafana/grafana.ini resulting in the following ending:

Percona has built the predefined dashboards for Grafana with Prometheus for you.

Let’s get them deployed:

It is important to apply the following minor patch on Grafana 2.6 in order to use the interval template variable to get the good zoomable graphs. The fix is simply to allow variable in Step field on Grafana graph editor page. For more information, take a look at PR#3757 and PR#4257. We hope the last one will be released with the next Grafana version.

Those changes are idempotent.

Finally, start Grafana:

At this point, we are one step before being done. Login into Grafana web interface http://monitor_host:3000 (admin/admin).

Go to Data Sources and add one for Prometheus:
Grafana datasource

Now check out the dashboards and graphs. Say choose “System Overview” and period “Last 5 minutes” on top-right. You should see something similar:
Grafana screen
If your graphs are not populating ensure the system time is correct on the monitor host.

Samples

Here are some real-world samples (images are clickable and scrollable):


Enjoy!

Conclusion

Prometheus and Grafana is a great tandem for enabling monitoring and graphing capabilities for MySQL. The tools are pretty easy to deploy, they are designed for time series with high efficiency in mind. In the next blog posts I will talk more about technical aspects, problems and related stuff.


posted by LifeisSimple
2016. 6. 6. 22:11 Brain Trainning/DataBase

50 Important Queries in SQL Server


출처 : http://www.c-sharpcorner.com/article/50-important-queries-in-sql-server/


In this article I will explain some general purpose queries. I think each developer should have knowledge of these queries. These queries are not related to any specific topic of SQL. But knowledge of such queries can solve some complex tasks and may be used in many scenarios, so I decided to write an article on these queries.

Query 1: Retrieve List of All Database

  1. EXEC sp_helpdb  

Example:

Example

Query 2: Display Text of Stored Procedure, Trigger, View 

  1. exec sp_helptext @objname = 'Object_Name'  

Example:

Example

Query 3: Get All Stored Procedure Relate To Database

  1. SELECT DISTINCT o.name, o.xtype  
  2.   
  3. FROM syscomments c  
  4.   
  5. INNER JOIN sysobjects o ON c.id=o.id  
  6.   
  7. WHERE o.xtype='P'  

Example:

Example

To retrieve the View use “V” instead of “P” and for functions use “FN.

Query 4: Get All Stored Procedure Relate To Table

  1. SELECT DISTINCT o.name, o.xtype  
  2.   
  3. FROM syscomments c  
  4.   
  5. INNER JOIN sysobjects o ON c.id=o.id  
  6.   
  7. WHERE c.TEXT LIKE '%Table_Name%' AND o.xtype='P'  

Example:

Example

To retrieve the View use “V” instead of “P” and for functions use “FN.

Query 5: Rebuild All Index of Database

  1. EXEC sp_MSforeachtable @command1="print '?' DBCC DBREINDEX ('?', ' ', 80)"  
  2.   
  3. GO  
  4.   
  5. EXEC sp_updatestats  
  6.   
  7. GO  

Example:

Example

Query 6: Retrieve All dependencies of Stored Procedure: 

This query return all objects name that are using into stored procedure like table, user define function, another stored procedure.

Query:

  1. ;WITH stored_procedures AS (  
  2.   
  3. SELECT  
  4.   
  5. oo.name AS table_name,  
  6.   
  7. ROW_NUMBER() OVER(partition by o.name,oo.name ORDER BY o.name,oo.nameAS row  
  8.   
  9. FROM sysdepends d  
  10.   
  11. INNER JOIN sysobjects o ON o.id=d.id  
  12.   
  13. INNER JOIN sysobjects oo ON oo.id=d.depid  
  14.   
  15. WHERE o.xtype = 'P' AND o.name LIKE '%SP_NAme%' )  
  16.   
  17. SELECT Table_name FROM stored_procedures  
  18.   
  19. WHERE row = 1  

Example:

Example

Query 7: Find Byte Size Of All tables in database

  1. SELECT sob.name AS Table_Name,  
  2.   
  3. SUM(sys.length) AS [Size_Table(Bytes)]  
  4.   
  5. FROM sysobjects sob, syscolumns sys  
  6.   
  7. WHERE sob.xtype='u' AND sys.id=sob.id  
  8.   
  9. GROUP BY sob.name  

Example:

Example

Query 8: Get all table that don’t have identity column:

Query:

  1. SELECT  
  2.   
  3. TABLE_NAME FROM INFORMATION_SCHEMA.TABLES  
  4.   
  5. where  
  6.   
  7. Table_NAME NOT IN  
  8.   
  9. (  
  10.   
  11. SELECT DISTINCT c.TABLE_NAME FROM INFORMATION_SCHEMA.COLUMNS c  
  12.   
  13. INNER  
  14.   
  15. JOIN sys.identity_columns ic  
  16.   
  17. on  
  18.   
  19. (c.COLUMN_NAME=ic.NAME))  
  20.   
  21. AND  
  22.   
  23. TABLE_TYPE ='BASE TABLE'  

Example:

Example

Query 9: List of Primary Key and Foreign Key for Whole Database

  1. SELECT  
  2.   
  3. DISTINCT  
  4.   
  5. Constraint_Name AS [Constraint],  
  6.   
  7. Table_Schema AS [Schema],  
  8.   
  9. Table_Name AS [TableName] FROM INFORMATION_SCHEMA.KEY_COLUMN_USAGE  
  10.   
  11. GO  

Example:

Example

Query 10: List of Primary Key and Foreign Key for a particular table

  1. SELECT  
  2.   
  3. DISTINCT  
  4.   
  5. Constraint_Name AS [Constraint],  
  6.   
  7. Table_Schema AS [Schema],  
  8.   
  9. Table_Name AS [TableName] FROM INFORMATION_SCHEMA.KEY_COLUMN_USAGE  
  10.   
  11. WHERE INFORMATION_SCHEMA.KEY_COLUMN_USAGE.TABLE_NAME='Table_Name'  
  12.   
  13. GO  

Example:

Example

Query 11: RESEED Identity of all tables

  1. EXEC sp_MSForEachTable '  
  2.   
  3. IF OBJECTPROPERTY(object_id(''?''), ''TableHasIdentity'') = 1  
  4.   
  5. DBCC CHECKIDENT (''?'', RESEED, 0)  

Example:

Example

Query 12: List of tables with number of records

  1. CREATE TABLE #Tab  
  2.   
  3. (  
  4.   
  5. Table_Name [varchar](max),  
  6.   
  7. Total_Records int  
  8.   
  9. );  
  10.   
  11. EXEC sp_MSForEachTable @command1=' Insert Into #Tab(Table_Name, Total_Records) SELECT ''?'', COUNT(*) FROM ?'  
  12.   
  13. SELECT * FROM #Tab t ORDER BY t.Total_Records DESC;  
  14.   
  15. DROP TABLE #Tab;  

Example:

Example

Query 13: Get the version name of SQL Server

  1. SELECT @@VERSION AS Version_Name  

Example:

Example

Query 14: Get Current Language of SQL Server

  1. SELECT @@LANGUAGE AS Current_Language;  

Example:

Example
Query 15: Disable all constraints of a table

  1. ALTER TABLE Table_Name NOCHECK CONSTRAINT ALL  

Example:

Example

Query16: Disable all constraints of all tables

  1. EXEC sp_MSForEachTable 'ALTER TABLE ? NOCHECK CONSTRAINT ALL'  

Example:

ExampleQuery 17: Get Current Language Id

  1. SELECT @@LANGID AS 'Language ID'  

Example:

Example

Query18: Get precision level used by decimal and numeric as current set in Server:

  1. SELECT @@MAX_PRECISION AS 'MAX_PRECISION'  

Example:

Example

Query 19: Return Server Name of SQL Server

  1. SELECT @@SERVERNAME AS 'Server_Name'  

Example:

Example

Query 20: Get name of register key under which SQL Server is running

  1. SELECT @@SERVICENAME AS 'Service_Name'  


Example:

Example

Query 21: Get Session Id of current user process

  1. SELECT @@SPID AS 'Session_Id'  

Example:

Example

Query22: Get Current Value of TEXTSIZE option

  1. SELECT @@TEXTSIZE AS 'Text_Size'  

Example:

Example

Query 23: Retrieve Free Space of Hard Disk

  1. EXEC master..xp_fixeddrives  

Example:

example

Query24: Disable a Particular Trigger

Syntax:

  1. ALTER TABLE Table_Name DISABLE TRIGGER Trigger_Name  

Example:

  1. ALTER TABLE Employee DISABLE TRIGGER TR_Insert_Salary  

Query 25: Enable a Particular Trigger

Syntax:

  1. ALTER TABLE Table_Name ENABLE TRIGGER Trigger_Name  

Example:

  1. ALTER TABLE Employee ENABLE TRIGGER TR_Insert_Salary  

Query 26: Disable All Trigger of a table

We can disable and enable all triggers of a table using previous query, but replacing the "ALL" instead of trigger name.

Syntax:

  1. ALTER TABLE Table_Name DISABLE TRIGGER ALL  

Example:

  1. ALTER TABLE Demo DISABLE TRIGGER ALL  

Query 27: Enable All Trigger of a table

  1. ALTER TABLE Table_Name ENABLE TRIGGER ALL  

Example:

  1. ALTER TABLE Demo ENABLE TRIGGER ALL  

Query 28: Disable All Trigger for database

Using sp_msforeachtable system stored procedure we enable and disable all triggers for a database.

Syntax:

  1. Use Database_Name  
  2.   
  3. Exec sp_msforeachtable "ALTER TABLE ? DISABLE TRIGGER all"  

Example:

example

Query29: Enable All Trigger for database

  1. Use Demo  
  2.   
  3. Exec sp_msforeachtable "ALTER TABLE ? ENABLE TRIGGER all"  

Example:

example

Query30: List of Stored procedure modified in last N days

  1. SELECT name,modify_date  
  2.   
  3. FROM sys.objects  
  4.   
  5. WHERE type='P'  
  6.   
  7. AND DATEDIFF(D,modify_date,GETDATE())< N  

Example:

example

Query31: List of Stored procedure created in last N days

  1. SELECT name,sys.objects.create_date  
  2.   
  3. FROM sys.objects  
  4.   
  5. WHERE type='P'  
  6.   
  7. AND DATEDIFF(D,sys.objects.create_date,GETDATE())< N  

Example:

Example

Query32: Recompile a stored procedure

  1. EXEC sp_recompile'Procedure_Name';  
  2.   
  3. GO  

Example:

Example

Query 33: Recompile all stored procedure on a table

  1. EXEC sp_recompile N'Table_Name';  
  2.   
  3. GO  

Example:

Example

Query 34: Get all columns of a specific data type:

Query:

  1. SELECT OBJECT_NAME(c.OBJECT_ID) as Table_Name, c.name as Column_Name  
  2.   
  3. FROM sys.columns AS c  
  4.   
  5. JOIN sys.types AS t ON c.user_type_id=t.user_type_id  
  6.   
  7. WHERE t.name = 'Data_Type'  

Example:

Example

Query 35: Get all Nullable columns of a table

  1. SELECT OBJECT_NAME(c.OBJECT_ID) as Table_Name, c.name as Column_Name  
  2.   
  3. FROM sys.columns AS c  
  4.   
  5. JOIN sys.types AS t ON c.user_type_id=t.user_type_id  
  6.   
  7. WHERE c.is_nullable=0 AND OBJECT_NAME(c.OBJECT_ID)='Table_Name'  

Example:

Example

Query 36: Get All table that don’t have primary key

  1. SELECT name AS Table_Name  
  2.   
  3. FROM sys.tables  
  4.   
  5. WHERE OBJECTPROPERTY(OBJECT_ID,'TableHasPrimaryKey') = 0  
  6.   
  7. ORDER BY Table_Name;  

Example:

Example

Query 37: Get All table that don’t have foreign key

  1. SELECT name AS Table_Name  
  2.   
  3. FROM sys.tables  
  4.   
  5. WHERE OBJECTPROPERTY(OBJECT_ID,'TableHasForeignKey') = 0  
  6.   
  7. ORDER BY Table_Name;  

Example:

Example

Query 38: Get All table that don’t have identity column

  1. SELECT name AS Table_Name  
  2.   
  3. FROM sys.tables  
  4.   
  5. WHERE OBJECTPROPERTY(OBJECT_ID,'TableHasIdentity') = 0  
  6.   
  7. ORDER BY Table_Name;  

Example:

Example
Query 39: Get First Date of Current Month

  1. SELECT CONVERT(VARCHAR(25),DATEADD(DAY,-(DAY(GETDATE()))+1,GETDATE()),105) First_Date_Current_Month;  

Example:

Example

Query 40: Get last date of previous month

  1. SELECT CONVERT(VARCHAR(25),DATEADD(DAY,-(DAY(GETDATE())),GETDATE()),105) Last_Date_Previous_Month;  

Example:

Example

Query 41: Get last date of current month

  1. SELECT CONVERT(VARCHAR(25),DATEADD(DAY,-(DAY(GETDATE())), DATEADD(MONTH,1,GETDATE())),105) Last_Date_Current_Month;  

Example:

Example

Query 42: Get first date of next month

  1. SELECT CONVERT(VARCHAR(25),DATEADD(DAY,-(DAY(GETDATE())), DATEADD(MONTH,1,GETDATE())+1),105) First_Date_Next_Month;  

Example:

Example

Query 43: Swap the values of two columns

  1. UPDATE Table_Name SET Column1=Column2, Column2=Column1  

Example:

Example

Query 44: Remove all stored procedure from database

  1. Declare @Drop_SP Nvarchar(MAX)  
  2.   
  3. Declare My_Cursor Cursor For Select [nameFrom sys.objects where type = 'p'  
  4.   
  5. Open My_Cursor  
  6.   
  7. Fetch Next From My_Cursor Into @Drop_SP  
  8.   
  9. While @@FETCH_STATUS= 0  
  10.   
  11. Begin  
  12.   
  13. Exec('DROP PROCEDURE ' + @Drop_SP)  
  14.   
  15. Fetch Next From My_Cursor Into @Drop_SP  
  16.   
  17. End  
  18.   
  19. Close My_Cursor  
  20.   
  21. Deallocate My_Cursor  

Example:

Example
Query 45: Remove all views from database

  1. Declare @Drop_View Nvarchar(MAX)  
  2.   
  3. Declare My_Cursor Cursor For Select [nameFrom sys.objects where type = 'v'  
  4.   
  5. Open My_Cursor  
  6.   
  7. Fetch Next From My_Cursor Into @Drop_View  
  8.   
  9. While @@FETCH_STATUS = 0  
  10.   
  11. Begin  
  12.   
  13. Exec('DROP VIEW ' + @Drop_View)  
  14.   
  15. Fetch Next From My_Cursor Into @Drop_View  
  16.   
  17. End  
  18.   
  19. Close My_Cursor  
  20.   
  21. Deallocate My_Cursor  

Example:

Example

Query 46: Drop all tables

  1. EXEC sys.sp_MSforeachtable @command1 = 'Drop Table ?'  

Example:

Example

Query 47: Get information of tables’ columns

  1. SELECT * FROM INFORMATION_SCHEMA.COLUMNS  
  2.   
  3. WHERE INFORMATION_SCHEMA.COLUMNS.TABLE_NAME=’Table_Name’  

Example:

Example

Query 48: Get all columns contain any constraints

  1. SELECT TABLE_NAME,COLUMN_NAME,CONSTRAINT_NAME FROM INFORMATION_SCHEMA.CONSTRAINT_COLUMN_USAGE  

Example:

Example

Query 49: Get all tables that contain a view

  1. SELECT * FROM INFORMATION_SCHEMA.VIEW_TABLE_USAGE  

Example:

Example

Query 50: Get all columns of table that using in views

  1. SELECT * FROM INFORMATION_SCHEMA.VIEW_COLUMN_USAGE  

Example:

Example

Read more articles on SQL Queries:


posted by LifeisSimple
2016. 4. 27. 10:22 Brain Trainning/DataBase

SP_Spaceused 라는 ... Procedure 를 확장한 버전

 - 파티셔닝 대상 등을 확인하거나 데이터 사이즈를 줄이기 위한 대상을 확인할때 유용함.


SELECT

    t.NAME AS TableName,

    s.Name AS SchemaName,

    p.rows AS RowCounts,

    SUM(a.total_pages) * 8 AS TotalSpaceKB,

    SUM(a.used_pages) * 8 AS UsedSpaceKB,

    (SUM(a.total_pages) - SUM(a.used_pages)) * 8 AS UnusedSpaceKB

FROM

    sys.tables t

INNER JOIN     

    sys.indexes i ON t.OBJECT_ID = i.object_id

INNER JOIN

    sys.partitions p ON i.object_id = p.OBJECT_ID AND i.index_id = p.index_id

INNER JOIN

    sys.allocation_units a ON p.partition_id = a.container_id

LEFT OUTER JOIN

    sys.schemas s ON t.schema_id = s.schema_id

WHERE

    t.NAME NOT LIKE 'dt%'

    AND t.is_ms_shipped = 0

    AND i.OBJECT_ID > 255

GROUP BY

    t.Name, s.Name, p.Rows

ORDER BY

    t.Name


posted by LifeisSimple
2016. 4. 26. 10:33 Brain Trainning/DataBase

XA 트랜잭션의 이해


출처 : https://msdn.microsoft.com/ko-kr/library/aa342335(v=sql.110).aspx


SQL Server용 Microsoft JDBC Driver는 Java Platform, Enterprise Edition/JDBC 2.0 분산 트랜잭션(옵션)을 지원합니다.SQLServerXADataSource 클래스에서 가져온 JDBC 연결은 Java Platform, Enterprise Edition(Java EE) 응용 프로그램 서버와 같은 표준 분산 트랜잭션 처리 환경에 참여할 수 있습니다.

System_CAPS_ICON_warning.jpg 경고


SQL용 Microsoft JDBC Driver 4.2에서는 준비되지 않은 트랜잭션의 자동 롤백에 대한 기존 기능에 대해 새로운 제한 시간 옵션을 제공합니다. 자세한 내용은 이 항목의 뒷부분에 나오는 준비되지 않은 트랜잭션의 자동 롤백에 대해 서버 쪽 제한 시간 설정을 구성합니다.을 참조하세요.

분산 트랜잭션을 구현하는 데 필요한 클래스는 다음과 같습니다.

클래스 구현 설명
com.microsoft.sqlserver.jdbc.SQLServerXADataSource javax.sql.XADataSource 분산 연결용 클래스 팩터리입니다.
com.microsoft.sqlserver.jdbc.SQLServerXAResource javax.transaction.xa.XAResource 트랜잭션 관리자용 리소스 어댑터입니다.
System_CAPS_ICON_note.jpg 참고


XA 분산 트랜잭션 연결의 기본값은 커밋된 읽기 격리 수준입니다.

다음은 밀접하게 결합된 트랜잭션에 적용되는 추가 지침입니다.

  • XA 트랜잭션을 MS DTC(Microsoft Distributed Transaction Coordinator)와 함께 사용할 경우 MS DTC의 현재 버전이 밀접하게 결합된 XA 분기 동작을 지원하지 않습니다. 예를 들어 MS DTC에는 XID(XA 분기 트랜잭션 ID)와 MS DTC 트랜잭션 ID 간에 일 대 일 매핑이 있으며 느슨하게 연결된 XA 분기에서 수행되는 작업이 다른 작업과 격리됩니다.

    MSDTC 및 밀접하게 결합된 트랜잭션에서 제공하는 핫픽스는 같은 GTRID(전역 트랜잭션 ID)를 사용하는 여러 개의 XA 분기가 한 개의 MS DTC 트랜잭션 ID에 매핑되는 밀접하게 결합된 XA 분기를 지원합니다. 이러한 지원을 통해 밀접하게 결합된 XA 분기가 SQL Server와 같은 리소스 관리자에서 다른 XA 분기의 변경 내용을 확인할 수 있습니다.

  • SSTRANSTIGHTLYCPLD 플래그를 사용하면 BQUAL(XA 분기 트랜잭션 ID)은 다르지만 GTRID(전역 트랜잭션 ID) 및 FormatID(형식 ID)는 같은 밀접하게 결합된 XA 트랜잭션을 응용 프로그램에서 사용할 수 있습니다. 이 기능을 사용하려면 XAResource.start 메서드의 flags 매개 변수에 SSTRANSTIGHTLYCPLD를 설정해야 합니다.

    xaRes.start(xid, SQLServerXAResource.SSTRANSTIGHTLYCPLD);


MS DTC(Microsoft Distributed Transaction Coordinator)와 XA 데이터 원본을 함께 사용하여 분산 트랜잭션을 처리하려면 다음과 같은 단계가 필요합니다.

System_CAPS_ICON_note.jpg 참고


JDBC 분산 트랜잭션 구성 요소는 JDBC 드라이버 설치의 xa 디렉터리에 있습니다. 이 구성 요소에는 xa_install.sql 및 sqljdbc_xa.dll 파일이 포함됩니다.

MS DTC 서비스 실행

MS DTC 서비스는 서비스 관리자에서 자동으로 표시하여 SQL Server 서비스를 시작할 때 자동으로 실행되도록 해야 합니다. XA 트랜잭션에 대해 MS DTC를 활성화하려면 다음 단계를 따릅니다.

Windows Vista 이상:

  1. 시작 단추를 클릭하고 검색 시작 상자에 dcomcnfg를 입력한 다음 Enter 키를 눌러 구성 요소 서비스를 엽니다.시작검색 상자에 %windir%\system32\comexp.msc를 입력하여 구성 요소 서비스를 열 수도 있습니다.

  2. 구성 요소 서비스, 컴퓨터, 내 컴퓨터를 확장한 다음 Distributed Transaction Coordinator를 확장합니다.

  3. 로컬 DTC를 마우스 오른쪽 단추로 클릭한 다음 속성을 선택합니다.

  4. 로컬 DTC 속성 대화 상자의 보안 탭을 클릭합니다.

  5. XA 트랜잭션 사용 확인란을 선택하고 확인을 클릭합니다. 이렇게 하면 MS DTC 서비스가 다시 시작됩니다.

  6. 확인을 다시 클릭하여 속성 대화 상자를 닫은 후 구성 요소 서비스를 닫습니다.

  7. SQL Server를 중지한 후 다시 시작하여 MS DTC 변경 내용과 동기화되도록 합니다.

JDBC 분산 트랜잭션 구성 요소 구성

다음과 같은 단계를 통해 JDBC 드라이버 분산 트랜잭션 구성 요소를 구성할 수 있습니다.

  1. JDBC 드라이버 설치 디렉터리에 있는 새 sqljdbc_xa.dll을 분산 트랜잭션에 참여할 모든 SQL Server 컴퓨터의 Binn 디렉터리에 복사합니다.

    System_CAPS_ICON_note.jpg 참고


    32비트 SQL Server에서 XA 트랜잭션을 사용할 경우 SQL Server가 x64 프로세서에 설치되었더라도 x86 폴더에 있는 sqljdbc_xa.dll을 사용하십시오. x64 프로세서의 64비트 SQL Server에서 XA 트랜잭션을 사용할 경우 x64 폴더에 있는 sqljdbc_xa.dll을 사용하십시오.

  2. 분산 트랜잭션에 참여할 모든 SQL Server 인스턴스에서 데이터베이스 스크립트 xa_install.sql을 실행합니다. 이 스크립트는 sqljdbc_xa.dll에서 호출하는 확장 저장 프로시저를 설치합니다. 이 확장 저장 프로시저는 SQL Server용 Microsoft JDBC Driver에 대한 분산 트랜잭션 및 XA 지원을 구현합니다. 이 스크립트를 실행하려면 SQL Server 인스턴스의 관리자 권한이 필요합니다.

  3. 특정 사용자에게 JDBC 드라이버를 통해 분산 트랜잭션에 참여할 권한을 부여하려면 해당 사용자를 SqlJDBCXAUser 역할에 추가합니다.

SQL Server 인스턴스마다 한 번에 하나의 sqljdbc_xa.dll 어셈블리 버전만 구성할 수 있습니다. 응용 프로그램에서 여러 버전의 JDBC 드라이버를 사용하여 XA 연결을 통해 동일한 SQL Server 인스턴스에 연결해야 하는 경우가 있을 수 있습니다. 이 경우 최신 JDBC 드라이버와 함께 제공되는 sqljdbc_xa.dll을 SQL Server 인스턴스에 설치해야 합니다.

현재 SQL Server SQL Server 인스턴스에 설치되어 있는 sqljdbc_xa.dll 버전은 다음 세 가지 방법으로 확인할 수 있습니다.

  1. 분산 트랜잭션에 참여할 SQL Server 컴퓨터의 LOG 디렉터리를 엽니다.SQL Server "ERRORLOG" 파일을 선택하여 엽니다. "ERRORLOG" 파일에서 "Using 'SQLJDBC_XA.dll' version ..." 구를 검색합니다.

  2. 분산 트랜잭션에 참여할 SQL Server 컴퓨터의 Binn 디렉터리를 엽니다. sqljdbc_xa.dll 어셈블리를 선택합니다.

    • Windows Vista 이상: sqljdbc_xa.dll을 마우스 오른쪽 단추로 클릭한 다음 속성을 선택합니다. 그런 다음 자세히 탭을 클릭합니다.파일 버전 필드에 현재 SQL Server 인스턴스에 설치되어 있는 sqljdbc_xa.dll 버전이 표시됩니다.
  3. 다음 섹션의 코드 예제에서와 같이 로깅 기능을 설정합니다. 출력 로그 파일에서 "Server XA DLL version:..." 구를 검색합니다.

준비되지 않은 트랜잭션의 자동 롤백에 대해 서버 쪽 제한 시간 설정을 구성합니다.

System_CAPS_ICON_warning.jpg 경고


이 서버 쪽 옵션은 SQL Server용 Microsoft JDBC Driver 4.2의 새로운 기능입니다. 업데이트된 동작을 가져오려면 서버에서 sqljdbc_xa.dll이 업데이트되었는지 확인하십시오. 클라이언트 쪽 제한 시간 설정에 대한 자세한 내용은 XAResource.setTransactionTimeout()을 참조하세요.

분산 트랜잭션의 제한 시간 동작을 제어하는 두 가지 레지스트리 설정(DWORD 값)이 있습니다.

  • XADefaultTimeout(초): 사용자가 제한 시간을 지정하지 않는 경우 사용할 기본 제한 시간 값입니다. 기본값은 0입니다.

  • XAMaxTimeout(초): 사용자가 설정할 수 있는 최대 제한 시간 값입니다. 기본값은 0입니다.

이러한 설정은 SQL Server 인스턴스와 관련되며 다음 레지스트리 키 아래에 만들어야 합니다.

HKEY_LOCAL_MACHINE\SOFTWARE\Microsoft\Microsoft SQL Server\MSSQL<version>.<instance_name>\XATimeout

System_CAPS_ICON_note.jpg 참고


64비트 컴퓨터에서 실행되는 32비트 SQL Server의 경우 다음 키 아래에 레지스트리 설정을 만들어야 합니다. HKEY_LOCAL_MACHINE\SOFTWARE\Wow6432Node\Microsoft\Microsoft SQL Server\MSSQL<version>.<instance_name>\XATimeout

제한 시간 값은 트랜잭션이 시작되고 제한 시간이 만료되는 경우 SQL Server에 의해 롤백될 때 각 트랜잭션에 대해 설정됩니다. 제한 시간을 이러한 레지스트리 설정 및 사용자가 XAResource.setTransactionTimeout()을 통해 지정한 설정에 따라 결정됩니다. 이러한 제한 시간 값이 해석되는 방식에 대한 몇 가지 예제는 다음과 같습니다.

  • XADefaultTimeout = 0, XAMaxTimeout = 0

    기본 제한 시간 없음이 사용되고 최대 제한 시간 없음이 클라이언트에 적용됨을 의미합니다. 이 경우 클라이언트에서 XAResource.setTransactionTimeout을 사용하여 제한 시간을 설정하는 경우에만 트랜잭션의 제한 시간이 설정됩니다.

  • XADefaultTimeout = 60, XAMaxTimeout = 0

    클라이언트에서 제한 시간을 지정하지 않는 경우 모든 트랜잭션의 제한 시간이 60초가 됨을 의미합니다. 클라이언트에서 제한 시간을 지정하면 해당 제한 시간 값이 사용됩니다. 최대 제한 시간 값 없음이 적용됩니다.

  • XADefaultTimeout = 30, XAMaxTimeout = 60

    클라이언트에서 제한 시간을 지정하지 않는 경우 모든 트랜잭션의 제한 시간이 30초가 됨을 의미합니다. 클라이언트에서 제한 시간을 지정하면 60초(최대값)보다 작은 경우에 한해 클라이언트의 제한 시간이 사용됩니다.

  • XADefaultTimeout = 0, XAMaxTimeout = 30

    클라이언트에서 제한 시간을 지정하지 않는 경우 모든 트랜잭션의 제한 시간이 30초(최대값)가 됨을 의미합니다. 클라이언트에서 제한 시간을 지정하면 30초(최대값)보다 작은 경우에 한해 클라이언트의 제한 시간이 사용됩니다.

sqljdbc_xa.dll 업그레이드

새 버전의 JDBC 드라이버를 설치할 때 서버에서 sqljdbc_xa.dll을 업그레이드하기 위해 새 버전의 sqljdbc_xa.dll을 사용해야 합니다.

System_CAPS_ICON_important.jpg 중요


유지 관리 창에 있는 동안 또는 프로세스에 MS DTC 트랜잭션이 없을 때 sqljdbc_xa.dll을 업그레이드해야 합니다.

  1. Transact-SQL 명령 DBCC sqljdbc_xa (FREE)를 사용하여 sqljdbc_xa.dll을 언로드합니다.

  2. JDBC 드라이버 설치 디렉터리에 있는 새 sqljdbc_xa.dll을 분산 트랜잭션에 참여할 모든 SQL Server 컴퓨터의 Binn 디렉터리에 복사합니다.

    sqljdbc_xa.dll의 확장 프로시저가 호출되면 새 DLL이 로드됩니다. 새 정의를 로드하기 위해 SQL Server를 다시 시작할 필요가 없습니다.

사용자 정의 역할 구성

특정 사용자에게 JDBC 드라이버를 통해 분산 트랜잭션에 참여할 권한을 부여하려면 해당 사용자를 SqlJDBCXAUser 역할에 추가합니다. 예를 들어 다음과 같은 Transact-SQL 코드를 사용하여 이름이 'shelby'(SQL 표준 로그인 사용자 이름)인 사용자를 SqlJDBCXAUser 역할에 추가합니다.

USE master
GO
EXEC sp_grantdbaccess 'shelby', 'shelby'
GO
EXEC sp_addrolemember [SqlJDBCXAUser], 'shelby'

SQL 사용자 정의 역할은 데이터베이스별로 정의합니다. 보안을 위해 고유한 역할을 만들려면 각 데이터베이스마다 역할을 정의하고 각 데이터베이스의 방식대로 사용자를 추가해야 합니다. SqlJDBCXAUser 역할은 master에 상주하는 SQL JDBC 확장 저장 프로시저에 대한 액세스 권한을 부여하는 데 사용되므로 master 데이터베이스에서만 정의할 수 있습니다. 먼저 개별 사용자에게 master에 대한 액세스 권한을 부여한 다음 master 데이터베이스에 로그인된 상태에서 SqlJDBCXAUser 역할에 대한 액세스 권한을 부여해야 합니다.

import java.net.Inet4Address;
import java.sql.*;
import java.util.Random;
import javax.transaction.xa.*;
import javax.sql.*;
import com.microsoft.sqlserver.jdbc.*;

public class testXA {

   public static void main(String[] args) throws Exception {

      // Create variables for the connection string.
      String prefix = "jdbc:sqlserver://";
      String serverName = "localhost";
      int portNumber = 1433;
      String databaseName = "AdventureWorks"; 
      String user = "UserName"; 
      String password = "*****";
      String connectionUrl = prefix + serverName + ":" + portNumber
         + ";databaseName=" + databaseName + ";user=" + user + ";password=" + password;

      try {
         // Establish the connection.
         Class.forName("com.microsoft.sqlserver.jdbc.SQLServerDriver");
         Connection con = DriverManager.getConnection(connectionUrl);

         // Create a test table.
         Statement stmt = con.createStatement();
         try {
            stmt.executeUpdate("DROP TABLE XAMin"); 
         }
         catch (Exception e) {
         }
         stmt.executeUpdate("CREATE TABLE XAMin (f1 int, f2 varchar(max))");
         stmt.close();
         con.close();

         // Create the XA data source and XA ready connection.
         SQLServerXADataSource ds = new SQLServerXADataSource();
         ds.setUser(user);
         ds.setPassword(password);
         ds.setServerName(serverName);
         ds.setPortNumber(portNumber);
         ds.setDatabaseName(databaseName);
         XAConnection xaCon = ds.getXAConnection();
         con = xaCon.getConnection();

         // Get a unique Xid object for testing.
         XAResource xaRes = null;
         Xid xid = null;
         xid = XidImpl.getUniqueXid(1);

         // Get the XAResource object and set the timeout value.
         xaRes = xaCon.getXAResource();
         xaRes.setTransactionTimeout(0);

         // Perform the XA transaction.
         System.out.println("Write -> xid = " + xid.toString());
         xaRes.start(xid,XAResource.TMNOFLAGS);
         PreparedStatement pstmt = 
         con.prepareStatement("INSERT INTO XAMin (f1,f2) VALUES (?, ?)");
         pstmt.setInt(1,1);
         pstmt.setString(2,xid.toString());
         pstmt.executeUpdate();

         // Commit the transaction.
         xaRes.end(xid,XAResource.TMSUCCESS);
         xaRes.commit(xid,true);

         // Cleanup.
         con.close();
         xaCon.close();

         // Open a new connection and read back the record to verify that it worked.
         con = DriverManager.getConnection(connectionUrl);
         ResultSet rs = con.createStatement().executeQuery("SELECT * FROM XAMin");
         rs.next();
         System.out.println("Read -> xid = " + rs.getString(2));
         rs.close();
         con.close();
      } 

      // Handle any errors that may have occurred.
      catch (Exception e) {
         e.printStackTrace();
      }
   }
}

class XidImpl implements Xid {

   public int formatId;
   public byte[] gtrid;
   public byte[] bqual;
   public byte[] getGlobalTransactionId() {return gtrid;}
   public byte[] getBranchQualifier() {return bqual;}
   public int getFormatId() {return formatId;}

   XidImpl(int formatId, byte[] gtrid, byte[] bqual) {
      this.formatId = formatId;
      this.gtrid = gtrid;
      this.bqual = bqual;
   }

   public String toString() {
      int hexVal;
      StringBuffer sb = new StringBuffer(512);
      sb.append("formatId=" + formatId);
      sb.append(" gtrid(" + gtrid.length + ")={0x");
      for (int i=0; i<gtrid.length; i++) {
         hexVal = gtrid[i]&0xFF;
         if ( hexVal < 0x10 )
            sb.append("0" + Integer.toHexString(gtrid[i]&0xFF));
         else
            sb.append(Integer.toHexString(gtrid[i]&0xFF));
         }
         sb.append("} bqual(" + bqual.length + ")={0x");
         for (int i=0; i<bqual.length; i++) {
            hexVal = bqual[i]&0xFF;
            if ( hexVal < 0x10 )
               sb.append("0" + Integer.toHexString(bqual[i]&0xFF));
            else
               sb.append(Integer.toHexString(bqual[i]&0xFF));
         }
         sb.append("}");
         return sb.toString();
      }

      // Returns a globally unique transaction id.
      static byte [] localIP = null;
      static int txnUniqueID = 0;
      static Xid getUniqueXid(int tid) {

      Random rnd = new Random(System.currentTimeMillis());
      txnUniqueID++;
      int txnUID = txnUniqueID;
      int tidID = tid;
      int randID = rnd.nextInt();
      byte[] gtrid = new byte[64];
      byte[] bqual = new byte[64];
      if ( null == localIP) {
         try {
            localIP = Inet4Address.getLocalHost().getAddress();
         }
         catch ( Exception ex ) {
            localIP =  new byte[] { 0x01,0x02,0x03,0x04 };
         }
      }
      System.arraycopy(localIP,0,gtrid,0,4);
      System.arraycopy(localIP,0,bqual,0,4);

      // Bytes 4 -> 7 - unique transaction id.
      // Bytes 8 ->11 - thread id.
      // Bytes 12->15 - random number generated by using seed from current time in milliseconds.
      for (int i=0; i<=3; i++) {
         gtrid[i+4] = (byte)(txnUID%0x100);
         bqual[i+4] = (byte)(txnUID%0x100);
         txnUID >>= 8;
         gtrid[i+8] = (byte)(tidID%0x100);
         bqual[i+8] = (byte)(tidID%0x100);
         tidID >>= 8;
         gtrid[i+12] = (byte)(randID%0x100);
         bqual[i+12] = (byte)(randID%0x100);
         randID >>= 8;
      }
      return new XidImpl(0x1234, gtrid, bqual);
   }
}

JDBC 드라이버로 트랜잭션 수행

posted by LifeisSimple
2016. 4. 6. 14:32 Brain Trainning/DataBase

Sql server  버전별 페이징 쿼리


출처 : http://blog.sqlauthority.com/2013/04/14/sql-server-tricks-for-row-offset-and-paging-in-various-versions-of-sql-server/


USE AdventureWorks2012
GO
--------------------------------------------------
-- SQL Server 2012
--------------------------------------------------
DECLARE @RowsPerPage INT = 10@PageNumber INT = 6
SELECT SalesOrderDetailIDSalesOrderIDProductID
FROM Sales.SalesOrderDetail
ORDER BY SalesOrderDetailID
OFFSET 
(@PageNumber-1)*@RowsPerPage ROWS
FETCH NEXT @RowsPerPage ROWS ONLY
GO


--------------------------------------------------
-- SQL Server 2008 / R2
-- SQL Server 2005
--------------------------------------------------
DECLARE @RowsPerPage INT = 10@PageNumber INT = 6
SELECT SalesOrderDetailIDSalesOrderIDProductID
FROM (
SELECT SalesOrderDetailIDSalesOrderIDProductID,
ROW_NUMBER() OVER (ORDER BY SalesOrderDetailIDAS RowNum
FROM Sales.SalesOrderDetail AS SOD
WHERE SOD.RowNum BETWEEN ((@PageNumber-1)*@RowsPerPage)+1
AND @RowsPerPage*(@PageNumber)
GO


--------------------------------------------------
-- SQL Server 2000
--------------------------------------------------
DECLARE @RowsPerPage INT = 10@PageNumber INT = 6
SELECT SalesOrderDetailIDSalesOrderIDProductID
FROM
(
SELECT TOP (@RowsPerPage)
SalesOrderDetailIDSalesOrderIDProductID
FROM
(
SELECT TOP ((@PageNumber)*@RowsPerPage)
SalesOrderDetailIDSalesOrderIDProductID
FROM Sales.SalesOrderDetail
ORDER BY SalesOrderDetailID
AS SOD
ORDER BY SalesOrderDetailID DESC
AS SOD2
ORDER BY SalesOrderDetailID ASC
GO


posted by LifeisSimple
2016. 4. 4. 09:17 Brain Trainning/DataBase

* 가끔씩 필요한 백업파일의 백업사이즈 구하기

SELECT TOP 100

 s.database_name,

m.physical_device_name,

CAST(CAST(s.backup_size / 1000000 AS INT) AS VARCHAR(14)) + ' ' + 'MB' AS bkSize,

CAST(DATEDIFF(second, s.backup_start_date,

s.backup_finish_date) AS VARCHAR(4)) + ' ' + 'Seconds' TimeTaken,

s.backup_start_date,

CAST(s.first_lsn AS VARCHAR(50)) AS first_lsn,

CAST(s.last_lsn AS VARCHAR(50)) AS last_lsn,

CASE s.[type] WHEN 'D' THEN 'Full'

WHEN 'I' THEN 'Differential'

WHEN 'L' THEN 'Transaction Log'

END AS BackupType,

s.server_name,

s.recovery_model

FROM msdb.dbo.backupset s

INNER JOIN msdb.dbo.backupmediafamily m ON s.media_set_id = m.media_set_id

WHERE s.database_name = 'ezmesG2' -- Remove this line for all the database

ORDER BY backup_start_date DESC, backup_finish_date

GO

posted by LifeisSimple
2014. 10. 15. 17:39 Brain Trainning/DataBase


Decrypting MSSQL Database Link Server Passwords


출처 : https://www.netspi.com/blog/entryid/221/decrypting-mssql-database-link-server-passwords


Extracting cleartext credentials from critical systems is always fun. While MSSQL server hashes local SQL credentials in the database, linked server credentials are stored encrypted. And if MSSQL can decrypt them, so can you using the PowerShell script released along with this blog. From the offensive point of view, this is pretty far into post exploitation as sysadmin privileges are needed on the SQL server and local administrator privileges are needed on the Windows server. From the defensive point of view, this is just another reminder that unnecessary database links, database links with excessive privileges, and the use of SQL server authentication rather than integrated authentication can result in unnecessary risk. This blog should be interesting to database hackers and admins interested in learning more.

Linked Servers

Microsoft SQL Server allows users to create links to external data sources, typically to other MSSQL servers. When these links are created, they can be configured to use the current security context or static SQL server credentials. If SQL server credentials are used, the user account and password are saved to the database encrypted and thus they are stored in a reversible format. A one-way hash cannot be used, because the SQL server has to be able to access the cleartext credentials to authenticate to other servers. So, if the credentials are encrypted and not hashed, there must be a way for the SQL server to decrypt them prior to use. The remainder of this blog will focus on how that happens.

Linked Server Password Storage

MSSQL stores link server information, including the encrypted password, in master.sys.syslnklgns table. Specifically, the encrypted password is stored in the "pwdhash" column (even though it's not a hash). Below is an example:

The master.sys.syslnklgns table cannot be accessed using a normal SQL connection, but rather a Dedicated Administrative Connection (DAC) is needed (more information about DAC at http://technet.microsoft.com/en-us/library/ms178068%28v=sql.105%29.aspx). Sysadmin privileges are needed to start a DAC connection, but as local administrator privileges are needed anyways, that shouldn't be a problem. If local administrators don't have sysadmin privileges you'll just have to impersonate the MSSQL server account or local SYSTEM account. More details on this can be found on Scott's blog at https://www.netspi.com/blog/entryid/133/sql-server-local-authorization-bypass.

MSSQL Encryption

Time to introduce some MSSQL encryption basics. To move ahead, access to the Service Master Key (SMK) is required (more information about SMK at http://technet.microsoft.com/en-us/library/ms189060.aspx). According to microsoft.com "The Service Master Key is the root of the SQL Server encryption hierarchy. It is generated automatically the first time it is needed to encrypt another key." SMK is stored in master.sys.key_encryptions table and it can be identified by the key_id 102. SMK is encrypted using Windows Data Protection API (DPAPI) and there are two versions of it in the database; one encrypted as LocalMachine and the other in the context of CurrentUser (meaning the SQL Server service account here). We'll choose the former to extract the key as LocalMachine encryption uses the Machinekey for encryption and it can be decrypted without impersonating the service account. Below is an example of what that looks like:

Additional entropy is added to strengthen the encryption but the entropy bytes can be found in the registry at HKLM:\SOFTWARE\Microsoft\Microsoft SQL Server\[instancename]\Security\Entropy. Once again, local administrator privileges are needed to access the registry key. The entropy is stored in the registry for each MSSQL instance as shown below:

After that (and removing some padding / metadata from the encrypted value) we can decrypt the SMK using DPAPI.

Decrypting Linked Server Passwords

Based on the length of the SMK (or the MSSQL version) we can determine the encryption algorithm: MSSQL 2012 uses AES, earlier versions use 3DES. In additional, the pwdhash value has to be parsed a bit to find the encrypted password. The first answer referring Pro T-SQL Programmer's guide at http://stackoverflow.com/questions/2822592/how-to-get-compatibility-between-c-sharp-and-sql2k8-aes-encryption got me on the right track; even though the byte format didn't seem to match exactly like detailed on the page, it wasn't too hard to find the right bytes to encrypt. So now, using the SMK, it is possible to extract all of the link credentials (when SQL Server account is used, not Windows authentication) in cleartext.

Decrypting Linked Server Passwords with PowerShell - Get-MSSQLLinkPasswords.psm1

To automate the decryption of linked server credentials I wrote a PowerShell script called "Get-MSSQLLinkPasswords.psm1". It can be download from GitHub here:
https://github.com/NetSPI/Powershell-Modules/blob/master/Get-MSSQLLinkPasswords.psm1

The script must be run locally on the MSSQL server (as DPAPI requires access to the local machine key). The user executing the script must also have sysadmin access to all the database instances (for the DAC connection) and local admin privileges on the Windows server (to access the entropy bytes in registry). In addition, if UAC is enabled, the script must be ran as an administrator. Below is a summary of the process used by the script.

  1. Identify all of the MSSQL instances on the server.
  2. Attempt to create a DAC connection to each instance.
  3. Select the encrypted linked server credentials from the "pwdhash" column of the "mas-ter.sys.syslnklgns" table for each instance.
  4. Select the encrypted Service Master Key (SMK) from the "master.sys.key_encryptions" table of each instance where the "key_id" column is equal to 102. Select the version that has been encrypted as LocalMachine based on the "thumbprint" column.
  5. Extract the entropy value from the registry location HKLM:\SOFTWARE\Microsoft\Microsoft SQL Server\[instancename]\Security\Entropy.
  6. Use the information to decrypt the SMK.
  7. The script determines the encryption algorithm (AES or 3DES) used to encrypt the SMK based on SQL Server version and SMK key length.
  8. Use the SMK to decrypt the linked server credentials.
  9. If successful, the script displays the cleartext linked server credentials. Below is an example of the end result:

I've tested the script with MSSQL 2005, 2008, 2012, 2008 Express, and 2012 Express. There might be some bugs, but it appears to work reliably. Please let me know if you notice any errors or if I did not account for certain situations etc.

'Brain Trainning > DataBase' 카테고리의 다른 글

[MSSQL] 버전 별 페이징 쿼리  (0) 2016.04.06
[MSSQL] DB 백업사이즈  (0) 2016.04.04
[MSSQL] 2012 버전별 기능  (0) 2013.09.23
[MSSQL] 2000 -> 2005 시스템뷰 매핑  (0) 2013.08.05
[MSSQL] Database 서버 전체 복구  (0) 2013.02.20
posted by LifeisSimple