General
SQL Server Performance Tuning Tips
BY BRAD
MCGEHEE
When
your transaction log grows large and you want a quick way to shrink
it, try this option. Change the database recovery mode of the
database you want to shrink from “full” to “simple,” then
truncate the log file by performing a full backup of the database,
then switch back to the “full” recovery mode. By temporally
changing from the Full recovery model to the Simple recovery mode,
and then back, SQL Server will only keep the “active” portion of
the log, which is very small. Contributed by Tom Kitta.
*****
If
you need to delete all the rows in a table, don’t use DELETE to
delete them, as the DELETE statement is a logged operation and can
take a significant amount of time, especially if the table is large.
To perform the same task much faster, use the TRUNCATE TABLE instead,
which is not a logged operation. Besides deleting all of the records
in a table, this command will also reset the seed of any IDENTITY
column back to its original value.
After
you have run the TRUNCATE TABLE statement, it is important then to
manually update the statistics on this table using UPDATE STATISTICS.
This is because running TRUNCATE TABLE will not reset the statistics
for the table, which means that as you add data to the table, the
statistics for that table will be incorrect for a time period. Of
course, if you wait long enough, and if you have Auto Update
Statistics turned on for the database, then the statistics will
eventually catch up with themselves. But this may not happen quickly,
resulting in slowly performing queries because the Query Optimizer is
using out-of-date statistics.
*****
If
you use TRUNCATE TABLE instead of DELETE to remove all of the rows of
a table, TRUNCATE TABLE will not work when there are Foreign Key
references present for that table. A workaround is to DROP the
constraints before firing the TRUNCATE. Here’s a generic script
that will drop all existing Foreign Key constraints on a specific
table:
CREATE
TABLE dropping_constraints
(
cmd VARCHAR(8000)
)
INSERT
INTO dropping_constraints
SELECT
‘ALTER TABLE ['
+
t2.Table_Name +
'] DROP CONSTRAINT ‘
+
t1.Constraint_Name
FROM
INFORMATION_SCHEMA.REFERENTIAL_CONSTRAINTS
t1
INNER JOIN
INFORMATION_SCHEMA.CONSTRAINT_COLUMN_USAGE
t2
ON
t1.CONSTRAINT_NAME =
t2.CONSTRAINT_NAME
WHERE
t2.TABLE_NAME=’your_tablename_goes_here’
DECLARE @stmt
VARCHAR(8000)
DECLARE @rowcnt INT
SELECT TOP 1
@stmt=cmd FROM dropping_constraints
SET
@rowcnt=@@ROWCOUNT
WHILE @rowcnt<>0
BEGIN
EXEC
(@stmt)
SET @stmt = ‘DELETE FROM dropping_constraints
WHERE cmd =’+ QUOTENAME(@stmt,””)
EXEC (@stmt)
SELECT
TOP 1 @stmt=cmd FROM dropping_constraints
SET
@rowcnt=@@ROWCOUNT
END
DROP TABLE
dropping_constraints
The
above code can also be extended to drop all FK constraints in the
current database. To achieve this, just comment the WHERE clause.
*****
Don’t
run a screensaver on your production SQL Servers, it can
unnecessarily use CPU cycles that should be going to your
application. The only exception to this is the “blank screen”
screensaver, which is OK to use.
*****
Don’t
run SQL Server on the same physical server that you are running
Terminal Services, or Citrix software. Both Terminal Services and
Citrix are huge resource hogs, and will significantly affect the
performance of SQL Server. Running the administrative version of
Terminal Services on a SQL Server physical server, on the other hand,
is OK, and a good idea from a convenience point of view. As is
mentioned in other parts of this website, ideally, SQL Server should
run on a dedicated physical server. But if you have to share a SQL
Server with another application, make sure it is not Terminal
Services or Citrix.
*****
Use
sp_who or sp_who2 (sp_who2 is not documented in the SQL Server Books
Online, but offers more details than sp_who) to provide locking and
performance-related information about current connections to SQL
Server. Sometimes, when SQL Server is very busy, you can’t use
Enterprise Manager or Management Studio to view current connection
activity via the GUI, but you can always use these two commands from
Query Analyzer or Management Studio, even when SQL Server is very
busy.
*****
SQL
Server uses its own internal thread scheduler (called the UMS) when
running in either native thread mode or in fiber mode. By examining
the UMS’s Scheduler Queue Length, you can help determine whether or
not that the CPU or CPUs on the server are presenting a bottleneck.
This
is similar to checking the System Object: Processor Queue Length in
Performance Monitor. If you are not familiar with this counter, what
this counter tells you is how many threads are waiting to be executed
on the server. Generally, if there are more than two threads waiting
to be executed on a server, then that server can be assumed to have a
CPU bottleneck.
The
advantage of using the UMS’s Schedule Queue Length over the System
Object: Processor Queue Length is that it focuses strictly on SQL
Server threads, not all of the threads running on a server.
To
view what is going on inside the UMS, you can run the following
undocumented command:
DBCC
SQLPERF(UMSSTATS)
For
every CPU in your server, you will get Scheduler. Each Scheduler will
be identified with a number, starting with 0. So if you have four
CPUs in your server, there will be four Schedulers listed after
running the above command, Schedulers ID 0 through 3.
The
“num users” tells you the number of SQL threads there are for a
specific scheduler.
The
“num runnable,” or better known as the “Scheduler Queue
Length,” is the key indicator to watch. Generally, this number will
be 0, which indicates that there are no SQL Server threads waiting to
run. If this number is 2 or more, this indicates a possible CPU
bottleneck on the server. Keep in mind that the values presented by
this command are point data, which means that the values are only
accurate for the split second when they were captured, and will be
always changing. But if you run this command when the server is very
busy, the results should be indicative of what is going on at that
time. You may want to run this command multiple time to see what is
going on over time.
The
“num workers” refers to the actual number of worker threads there
are in the thread pool.
The
“idle workers” refers to the number of idle worker threads.
The
“cntxt switches” refers to the number of context switches between
runnable threads.
The
“cntxt switches(idle)” refers to the number of context switches
to “idle” threads.
As
you can see, this command is for advanced users, and is just one of
many tools that can be used to see internally how SQL Server is
performing.
Continues…
SQL
Server offers a system table-valued function that provides
statistical information on the I/O activity of specific database
files. It is called fn_virtualfilestats. What is interesting about
this function is that it is specific to a database file. For example,
if you want to see the I/O activity of a particular user database,
you can. Keep in mind that all SQL Server databases have at least two
physical files (for the database and log), and can have many more,
depending on how the database was created. When using this function,
you have to not only specify the database, but the file within the
database. This is very specific I/O statistics indeed. To run this
function, use the syntax found below:
SELECT
* FROM :: fn_virtualfilestats(dbid, fileid)
Where:
dbid:
The database ID of the database you want to examine.
fileid:
The file ID of the physical files that make up your database. At a
minimum, each database has at least two files: the database file (MDF
file) and a log file (LDF). A database can have many files, and the
file number refers to the number of the physical file that you want
to examine.
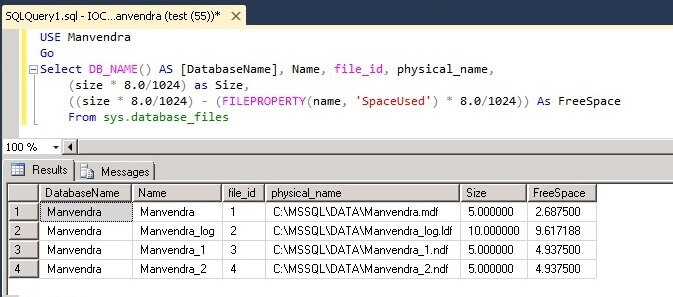
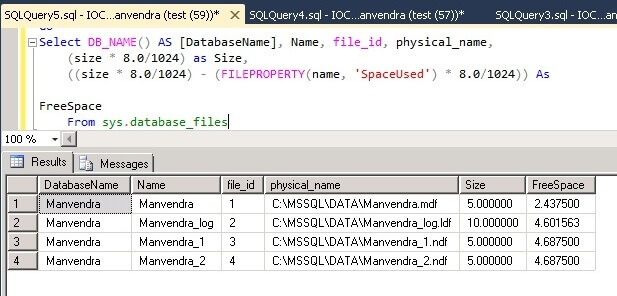
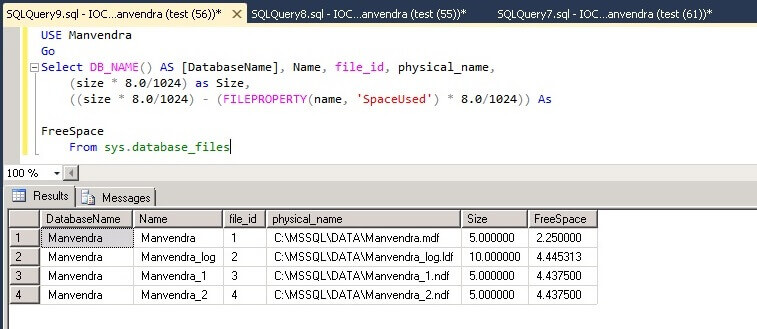
To
identify the dbid and fileid you want to use in the above statement,
run the following SELECT statement. It will provide you with a list
of all of the database names, database ids, and file ids (for each
database) on your server.
SELECT
sysdatabases.name AS Database_Name,
sysdatabases.dbid AS Database_ID,
sysaltfiles.fileid AS File_ID
FROM sysaltfiles INNER JOIN
sysdatabases
ON sysaltfiles.dbid =
sysdatabases.dbid
ORDER BY sysdatabases.name,
sysaltfiles.fileid
Once
you run this function, a wide variety of information is available,
including:
NumberReads:
The number of physical reads made against this file since the last
time SQL Server was restarted.
NumberWrites:
The number of physical writes made against this file since the last
time SQL Server was restarted.
BytesRead:
The number of bytes read from this file since the last time SQL
Server was restarted.
BytesWritten:
The number of writes to this file since the last time SQL Server was
restarted.
IoStallMS:
The total amount of time that users have waited for I/Os to complete
for this file (in milliseconds).
The
first four statistics can give you a feel for how busy a particular
file is. This can come in handy when comparing multiple filegroups in
a database and to see how balanced the I/O is to each file. To make
the most of filegroups, I/O should be spread out among the various
files for best overall performance. The last statistic, IoStallMS, is
best used to find out if you have a bottleneck in your transaction
log, as demonstrated below:
SELECT
IoStallMS / (NumberReads+NumberWrites) as IsStall
FROM ::
fn_virtualfilestats(dbid, fileid)
Where:
dbid:
The database ID of the database you want to examine.
fileid:
The file ID of the transaction log of the database being examined.
Essentially,
if IsStall is > 20ms, then this indicates that the I/O to the
transaction log is becoming a bottleneck, which in turn can lead to
major concurrently problems in the database.
To
help optimize the transaction log, assuming it has become a
bottleneck, consider doing the following:
• Place
the transaction log on a faster disk array.
• Place
the transaction log on a dedicated disk array (no other files other
than the transaction log). This allows sequential writes to occur as
fast as possible, helping to boost I/O performance.
• Turn
on write-back caching on your disk controller, but only if it is
backed up with a battery and has been tested to work with SQL Server.
Normally, write-back caching is turned off because it can cause
database corruption should the server crash.
*****
Sometimes,
a user thread has to wait until the resources it needs are available.
Hopefully, this won’t happen often, but it is a fact of life. But
sometimes, long waits can indicate potential performance problems
that can be corrected, if you know where to look. Long waits can be
caused by blocking locks, slow I/O, and other factors.
Fortunately,
you can access the amount of time a user thread has to wait, which
can tell you which user thread, if any, is taking more time that it
should. For example, the query below can be run to identify any user
threads that have to wait more than one second:
SELECT
spid, waittime, lastwaittype
FROM
master..sysprocesses
WHERE waittime > 1000
When
you run the above query, all of the processes that have been waiting
for greater than 1 second (1000 milliseconds) — both system and
user — will be displayed. You will want to ignore system processes,
focusing your efforts on spids that represent specific user threads.
Spid will give you the user ID (you will have to match the spid to
the appropriate user), waittime is the number of milliseconds that
this user thread has been waiting, and lastwaittype will give you a
clue as to what is waiting to occur.
In
the above query, I have used 1000 milliseconds as a cutoff point, but
you can use any amount of time you want. Generally speaking, any user
thread that has been waiting for five seconds or more should
definitely be evaluated for potential performance issues. Of course,
you can choose any threshold you want.
Continues…
By
default, you cannot use a UNC (Universal Naming Convention) name to
specify a location of where to store a SQL Server database or log
file. Instead, you must specify a drive letter that refers to a local
physical drive or array. But what if you want to store your database
or log file on another Windows Server or a Network Appliance, Inc.
storage system? You can, but you will have to set Trace Flag 1807 on
your SQL Server to allow the use of UNC names.
*****
For
a quick and dirty way to check to see if your SQL Server has maxed
out its memory (and is causing your server to page), try this. Bring
up the Task Manager and go to the “Performance” tab.
Here,
check out two numbers: the “Total” under “Commit Charge (k)”
and the “Total” under “Physical Memory (k)”. If the “Total”
under “Commit Charge (k)” is greater than the “Total” under
“Physical Memory (k)”, then your server does not have enough
physical memory to run efficiently as it is currently configured and
is most likely causing your server to page unnecessarily. Excess
paging will slow down your server’s performance.
Another
number to make note of is the “Available Physical Memory (K). This
number should be 4MB or higher. If it is not, then your SQL Server is
most likely suffering from a lack of physical RAM, hurting
performance, and more RAM needs to be added.
If
you notice this problem, you will probably want to use System Monitor
to further investigate the cause of this problem. You will also want
to check to see how much physical memory has been allocated to SQL
Server. Most likely, this setting has been set incorrectly, and SQL
Server has been set to use too much physical memory. Ideally, SQL
Server should be set to allocate physical RAM dynamically.
*****
When
performance tuning a SQL Server, it is often handy to know if the
disk I/O of your servers (and the databases on it) are mostly reads
or mostly writes. This information can be used to calculate the ratio
of writes to reads of your server, and this ratio can affect how you
might want to tune your SQL Server. For example, if you find that
your server is heavy on the writes, then you will want to avoid RAID
5 if you can, and use RAID 10 instead. This is because RAID 5 is much
less efficient that RAID 10 at writes. But if your server has a much
greater number of reads than writes, then perhaps a RAID 5 system is
more than adequate.
One
of the quickest ways to find out the ratio of reads to writes on your
SQL Servers is to run Task Manager and look at the sqlservr.exe
process (this is the mssqlserver or sqlserv service) and view the
total number of I/O Read Bytes and I/O Write Bytes. If you don’t
see this in Task Manager, go to View|Select Column, and add these two
columns to Task Manager.
The
results you see tell you how many bytes of data have been written and
read from the SQL Server service since it was last restarted. Because
of this, you don’t want to read this figure immediately after
starting the SQL Server service, but after several days of typical
use.
In
one particular case I looked at, the SQL Server had 415,006,801,908
I/O bytes read and 204,669,746,458 bytes written. This server had
about one write for every two reads. In this case, RAID 5 is probably
a good compromise in performance, assuming that RAID 10 is not
available from a budget perspective. But if the reverse were true,
and there were two writes for every one read, then RAID 10 would be
needed for best overall performance of SQL Server.
*****
Internet
Information Server (IIS) has the ability to send its log files
directly to SQL Server for storage. Busy IIS servers can actually get
bogged down trying to write log information directly to SQL Server.
Because of this, it is generally not recommended to write web logging
information to SQL Server. Instead, logs should be written to text
files, and later imported into SQL Server using BCP, DTS, or SSIS.
*****
SQL
Server has a database compatibility mode that allows applications
written for previous versions of SQL Server to run under the current
version of SQL Server. In you want maximum performance for your
database, you don’t want to run your database in compatibility mode
(not all new performance-related features are supported).
Instead,
your databases should be running in the current native SQL Server
mode. Of course, this may require you to modify your application to
make it compliant to the version of SQL Server you are running, but
in most cases, the additional work required to update your
application will be more than paid for with improved performance.
*****
When
experimenting with the tuning of your SQL Server, you may want to run
the DBCC DROPCLEANBUFFERS command to remove all the test data from
SQL Server’s data cache (buffer) between tests to ensure fair
testing. Keep in mind that this command only removes clean buffers,
not dirty buffers. Because of this, before running the DBCC
DROPCLEANBUFFERS command, you may first want to run the CHECKPOINT
command first. Running CHECKPOINT will write all dirty buffers to
disk. And then when you run DBCC DROPCLEANBUFFERS, you can be assured
that all data buffers are cleaned out, not just the clean ones.
If
you want to clear out all of the stored procedure cache, use this
command, DBCC FREEPROCCACHE. If you only want to clear out the stored
procedure cache for a single database (not the entire server) use
DBCC FLUSHPROCINDB. All of these commands are for testing purposes
and should not be run on a production SQL Server.
*****
Orphan
SQL Server sessions can negatively affect SQL Server’s performance.
An orphan SQL Server session can occur when a client improperly
disconnects from SQL Server, such as when the client loses power.
When this happens, the client cannot tell SQL Server to properly
close the connection, so the SQL Server connection remains open, even
though it is not being used.
This
can affect SQL Server’s performance two ways. First, orphaned
connections use up SQL Server connections, which takes up server
resources. Secondly, it is possible that the orphan connections may
be holding locks that block other users; or temp tables or cursors
may be held open that also take up unnecessary server resources.
The
OS periodically checks for inactive SQL Server sessions, and if it
finds any, it will notify SQL Server so that the connection can be
removed. Unfortunately, this only occurs every 1-2 hours, depending
on the protocol used. If orphaned SQL Server sessions become a
problem, Windows Server’s registry can be modified so that it
checks more often for orphaned connections.
Identifying
an orphaned connection from SQL Server is very difficult, but if you
can identify it, it can be removed by KILLing the connection using
SSMS or by running the KILL statement.
Continues…
For
best performance, don’t mix production databases and development
(test or staging) databases on the same physical server. This not
only serves to better separate the two functions (production and
development), but prevents developers from using up server resources
that could be better used by production users.
*****
When
we think of performance, we usually think about speeding up our
application’s performance. But another way to look at performance
is to look at our performance as DBAs or Transact-SQL developers.
For
example, one of the easiest ways to speed up our Transact-SQL coding,
in addition to making it easier to maintain and troubleshoot our code
once it is written, is to format it in an easy to read format.
While
there are many different code formatting guidelines available, here
are some basic ones you should consider following, if you aren’t
doing so already:
Begin
each line of your Transact-SQL code with a SQL verb, and capitalize
all Transact-SQL statements and clauses, such as:
SELECT
customer_number, customer_name
FROM customer
WHERE
customer_number > 1000
ORDER BY customer_number
If
a line of Transact-SQL code is too long to fit onto one line, indent
the following line(s), such as:
SELECT
customer_number, customer_name, customer_address,
customer_state, customer_zip, customer_phonenumber
Separate
logical groupings of Transact-SQL code by using appropriate comments
and documentation explaining what each grouping goes.
These
are just a few of the many possible guidelines you can follow when
writing your Transact-SQL code to make it more readable by you and
others. You just need to decide on some standard, and then always
follow it in your coding. If you do this, you will definitely boost
your coding performance.
*****
Be
wary of allowing users to directly access your databases (especially
OLTP databases) with third-party database access tools, such as
Microsoft Excel or Access. Many of these tools can wreck havoc with
your database’s performance. Here are some reasons why:
• Often
these users aren’t experienced using these tools, and create overly
complex queries that eat up server resources. At the other extreme,
their queries may not be complex enough (such as lacking effective
WHERE clauses) and return thousands, if not millions, or unnecessary
rows of data.
• This reporting activity can often
lock rows, pages or tables, creating user contention for data and
reducing the database’s performance.
• These tools
are often file-based. This means that even if an effective query is
written, the entire table (or multiple tables in the case of joins)
has to be returned to the client software where the query is actually
performed, not at the server. Not only can this lead to excess server
activity, it can also play havoc with your network.
If
you have no choice but to allow users access to your data, try to
avoid them hitting your production OLTP databases. Instead, point
them to a “reporting” server that has been replicated, or is in
the form of a datamart or data warehouse.
*****
SQL
Server offers support of SSL encryption between clients
and the server. While selecting this option prevents the data from
being viewed, it also adds additional overhead and reduces
performance. Only use SSL encryption if absolutely required. If you
need to use SSL encryption, consider purchasing a SSL encryption
processor for the server to speed performance.
*****
SQL
Server supports named instances of SQL Server. You can
run up to 16 concurrent instances of SQL Server on the
same server.
As
you might imagine, each running instance of SQL Server takes up
server resources. Although some resources are shared by multiple
running instances, such as MSDTC and the Microsoft Search services,
most are not. Because of this, each additional instance of SQL Server
running on the same server has to fight for available resources,
hurting performance.
For
best performance, run only a single instance (usually the default) on
a single physical server. The main reasons for using named instances
is for upgrading older versions of SQL Server to newer versions of
SQL Server, transition periods where you need to test your
applications on multiple versions of SQL Server, and for use on
development servers.
*****
If
you run the ALTER TABLE DROP COLUMN statement to drop a variable
length or text column, did you know that SQL Server will not
automatically reclaim this space after performing this action? To
reclaim this space, which will help to reduce unnecessary I/O due to
the wasted space, you can run the following command:
DBCC
CLEANTABLE (database_name, table_name)
Before
running this command, you will want to read about it in Books Online
to learn about some of its options that may be important to you.
*****
Trace
flags, which are used to enable and disable some special database
functions temporarily, can sometimes chew up CPU utilization and
other resources on your SQL Server unnecessarily. If you just use
them for a short time to help diagnose a problem, for example, and
then turn them off as soon as you are done using them, then the
performance hit you experience is small and temporary.
What
happens sometimes is that you, or another DBA, turns on a trace flag,
but forgets to turn it off. This of course, can negatively affect
your SQL Server’s performance. If you want to check to see if there
are any trace flags turned on a SQL Server, run this command in Query
Analyzer:
DBCC
TRACESTATUS(-1)
If
there are any trace flags on, you will see them listed on the screen
after running this command. DBCC TRACESTATUS only finds traces
created at the client (connection) level. If a trace has been turned
on for an entire server, this will not show up.
If
you find any, you can turn them off using this command:
DBCC
TRACEOFF(number of trace)
*****
SQL
Server offers a feature called the black box. When enabled, the black
box creates a trace file of the last 128K worth of queries and
exception errors. This can be a great tool for troubleshooting some
SQL Server problems, such as crashes.
Unfortunately,
this feature uses up SQL Server resources to maintain the trace file
than can negatively affect its performance. Generally, you will only
want to turn the black box on when troubleshooting, and turn it off
during normal production. This way, your SQL Server will be minimally
affected.
Continues…
If
you have ever performed a SELECT COUNT(*) on a very large table, you
know how long it can take. For example, when I ran the following
command on a large table I manage:
SELECT
COUNT(*) from <table_name>
It
took 1:09 to count 10,725,948 rows in the table. At the same time,
SQL Server had to perform a lot of logical and physical I/O in order
to perform the count, chewing up important SQL Server resources.
A
much faster, and more efficient, way of counting rows in a table is
to run the following query:
SELECT
rows
FROM sysindexes
WHERE id =
OBJECT_ID(‘<table_name>’) AND indid < 2
When
I run the query against the same table, it takes less than a second
to run, and it gave me the same results. Not a bad improvement and it
took virtually no I/O. This is because the row count of your tables
is stored in the sysindexes system table of your database. So instead
of counting rows when you need to, just look up the row count in the
sysindexes table.
There
is one potential downside to using the sysindexes table. And that
this system table is not updated in real time, so it might
underestimate the number of rows you actually have. Assuming you have
the database option turned on to “Auto Create Statistics” and
“Auto Update Statistics,” the value you get should be very close
to being correct, if not correct. If you can live with a very close
estimate, then this is the best way to count rows in your tables.
*****
Do
you use Enterprise Manager to access remote servers, possibly over a
slow WAN link? If you do, have you ever had any problems getting SSMS
to connect to the remote server?
If
so, the problem may lay in the fact that if Enterprise Manager cannot
make a connection within 4 seconds, then the connection attempt
fails. To overcome slow network connections, you can change the
default SSMS timeout value from 4 seconds to any amount of time you
like.
To
change the default timeout value, select Tools > Options from
Enterprise Manager, and then select the “Advanced”
tab. Here, change the “Login time-out (seconds)” option to a
higher number.
*****
SQLDIAG.exe
is a command line tools that collects information about SQL Server
and writes it to a text file. It can be useful for documenting or
troubleshooting your SQL Server. When you run this command when SQL
Server is running, the following information is collected and stored
in a text file called sqldiag.txt, which is stored in the mssqllog
folder.
The
text of all error logs
SQL Server registry information
SQL
Server dll version information
The output from these system
stored procedures:
sp_configure
sp_who
sp_lock
sp_helpdb
xp_msver
sp_helpextendedproc
sysprocesses
Input
buffer SPIDs/deadlock information
Microsoft diagnostics
report for the server
The last 100 queries and exceptions
(if the query history trace was running)
*****
Memory
leaks can steal valuable memory from your SQL Server, reducing
performance, and perhaps even forcing you to reboot your server. A
memory leak occurs when a poorly-written or buggy program requests
memory from the operating system, but does not release the memory
when it is done with it. Because of this, the application can use up
more and more memory in a server, greatly slowing it down, and even
perhaps crashing the server.
Some
memory leaks come from the operating system itself, device drivers,
MDAC components, and even SQL Server. And of course, virtually any
application can cause a memory leak, which is another good reason to
dedicate a single server to SQL Server instead of sharing it among
multiple applications.
Memory
leaks are often hard to identify, especially if they leak memory
slowly. Generally, memory leaks become apparent when you notice that
your server is running out of available memory and paging becomes a
big problem. A symptom of this is a SQL Server that runs quickly
after being rebooted, but begins to run more and more slowly as time
passes, and when the system is rebooted again, it speeds up again.
One
way to help get rid of many memory leaks is to ensure that you always
have the latest service packs or updates for your server’s
software. But a memory leak you find may not have an immediate fix.
If this is the case, you may be forced to reboot your server
periodically in order to free up memory.
Identifying
what is causing a memory leak is often difficult. One method involved
using System Monitor to monitor all of the counters in the Memory
object over time, seeing what is happening internally in your
computer. Another method is to use Task Manager to view how much
memory is used by each process. A process that seems to be using an
unusual amount of memory may be the culprit.
*****
While
SSMS can make some DBA and developer tasks a little bit easier, in
other cases, it can cause performance problems. For example, if you
decide to change the schema of a table from within SSMS, you may find
out that doing so takes much longer than performing the same schema
change by using the Transact-SQL ALTER command. This is because SSMS
may not use ALTER, but instead recreate an entire new table
based on your new schema, and the move the data from the old table to
the new table, which can take a long time for large tables.
Generally, using ALTER is very efficient and schema changes occur
quickly, even on large tables.
Because
of this, consider using ALTER to modify the schemas of very large
tables instead of SSMS.
*****
If
you want to see a detailed accounting of how memory is being used in
your SQL Server, run this undocumented DBCC command:
DBCC
MEMORYSTATUS
The
results look similar to this:
Buffer
Distribution
Value
——————————
———–
Stolen
2914
Free
3049
Procedures
43521
Inram
0
Dirty
8366
Kept
1209
I/O
0
Latched
0
Other
163981
Buffer
Counts
Value
——————————
———–
Commited
223040
Target
223040
Hashed
173556
InternalReservation
202
ExternalReservation
0
Min Free
201
Procedure
Cache
Value
——————————
———–
TotalProcs
28301
TotalPages
43521
InUsePages
19676
Dynamic
Memory Manager Value
——————————
———–
Stolen
46436
OS
507
General
7137
QueryPlan
39310
Optimizer
0
Utilities
13
Connection
483
Global
Memory Objects
Value
——————————
———–
Resource
932
Locks
78
XDES
1
SQLCache
1195
Replication
2
LockBytes
2
ServerGlobal
71
Query
Memory Manager
Value
——————————
———–
Grants
0
Waiting
0
Available
150336
Maximum
150336
Optimization
Queue
Value
——————————
———–
Optimizing
0
Waiting
0
Available
16
Maximum
16
The
value refers to the number of 8K buffers. [7.0, 2000] Updated
5-7-2007
Continues…
If
you would like to see what is stored in SQL Server’s stack, you can
by running this undocumented SQL Server DBCC command:
DBCC
STACKDUMP
When
you run this command, a stack dump will be performed, writing a file
named SQL00001.dmp in the SQL Server log folder. This is a text file
you can view with Notepad.
*****
Many
times it is useful to compare the performance of a query or stored
procedure as you are testing it. This is especially true if the time
differences are so small that it is hard for you to know for sure
which query was faster or slower.
One
of the easiest ways to measure the time it takes for a query to
stored procedure to run is to find the starting and ending times,
then find the difference between the two. This can be easily
accomplished using a few extra lines of Transact-SQL code. Here’s
how:
DECLARE
@starttime datetime
SELECT @starttime = GETDATE()
… Your
code here …
SELECT
DATEDIFF(ms, @starttime, GETDATE()) AS ‘Total Time (ms)’
The
results will be how long, in milliseconds, it took your code to run.
SQL Server’s time function is only accurate to +- 3 milliseconds,
so keep this mind.
*****
In
SSMS, the most common way to script currently existing objects is to
right-click on the database in question and select “All Tasks,”
then choose “Generate SQL Script,” and so on, until you script
the object you want. This works fine, but takes a lot of keystrokes.
Another
way, from within SSMS, to script existing objects is to follow these
steps instead:
• Open
the database and right-click on the object you want to script, then
click “Copy.” Or if you like keyboard shortcuts, press
CTRL-C.
• Open a copy of Query Analyzer, Notepad, or
any text editor.
• Now on the “Edit” menu from
the application, click “Paste” (or press CTRL-V), and the
scripted code appears, including any appropriate constraints.
This
is a quick and easy way to script database objects you may find
handy.
*****
Have
you ever wondered how people find out about “undocumented” stored
procedures? Have you ever wondered about how SQL Server works behind
the scenes? And have you ever wanted to see some examples of how
top-notch Transact-SQL developers write SQL code?
All
of the above is at your fingertips, although you won’t see many
references to it in Microsoft’s documentation. To accomplish all of
the above, all you have to do is go to your master SQL Server
database in SSMS, open the Stored Procedures Folder, and take a look.
All SQL Server stored procedures can be seen here, even the ones not
documented by Microsoft. To view the Transact-SQL code in a stored
procedure, right-click on the stored procedure you are interested in
and click Properties.
If
you want to use Query Analyzer instead, all you have to do is to use
this command:
USE
master
sp_helptext [system_stored_procedure_name]
In
many cases, the Transact-SQL code you see is documented (although
generally not in great detail), and if you know Transact-SQL, you
should be able to follow the code and understand how it works. In
some cases, you may need to experiment a little to better understand
what is going on.
For
example, here’s the Transact-SQL code for the sp_updatestats system
stored procedure:
CREATE
PROCEDURE sp_updatestats
AS
DECLARE
@dbsid varbinary(85)
SELECT
@dbsid = sid
FROM master.dbo.sysdatabases
WHERE
name = db_name()
/*Check
the user sysadmin*/
IF NOT is_srvrolemember(‘sysadmin’)
= 1 AND suser_sid() <> @dbsid
BEGIN
RAISERROR(15288,-1,-1,’SA
or DBO’,'sp_updatestats’)
RETURN (1)
END
DECLARE
@exec_stmt nvarchar(540)
DECLARE @tablename sysname
DECLARE
@uid smallint
DECLARE @user_name sysname
DECLARE
@tablename_header varchar(267)
DECLARE tnames_cursor CURSOR
FOR SELECT name, uid FROM sysobjects WHERE type = ‘U’
OPEN
tnames_cursor
FETCH NEXT FROM tnames_cursor INTO @tablename,
@uid
WHILE (@@fetch_status <> -1)
BEGIN
IF
(@@fetch_status <> -2)
BEGIN
SELECT
@user_name = user_name(@uid)
SELECT @tablename_header =
‘Updating ‘ + @user_name +’.'+ RTRIM(LOWER(@tablename))
PRINT
@tablename_header
SELECT @exec_stmt = ‘UPDATE STATISTICS ‘
+ quotename( @user_name , ‘[‘)+’.’ + quotename( @tablename,
‘[‘)
EXEC (@exec_stmt)
END
FETCH NEXT
FROM tnames_cursor INTO @tablename, @uid
END
PRINT
‘ ‘
PRINT ‘ ‘
raiserror(15005,-1,-1)
DEALLOCATE
tnames_cursor
RETURN(0) — sp_updatestats
GO
Besides
learning how system stored procedures work, and getting an
opportunity to see professionally written code, (if you really like
to get your hands dirty) you can also modify the code to do something
slightly different. By this, I don’t mean to modify the code you
see (that wouldn’t be prudent) but you can copy the code to a new
stored procedure, modify it, and then save it with a different name.
Continues…
On
very rare occasions, you may get an error similar to this from SQL
Server:
[Microsoft
SQL-DMO (ODBC SQLState: 42000)] Error 845: [Microsoft][ODBC SQL
Server Driver][SQL Server]Time-out occurred while waiting for buffer
latch type 3 for page (2:0), database ID 15.
This
error message may also be accompanied by additional error messages,
such as a file log or database backup that failed.
This
error indicates that your disk I/O system is being overloaded and
that SQL Server timed out when trying to write data to disk (via the
OS). If this error is a rare event, then there is no need to worry.
But
if this event becomes frequent, it could mean that your disk I/O
subsystem has hit a bottleneck that it can’t overcome, or that your
disk I/O subsystem itself is having problems. You need to find out
which one of these is the most likely issue, and then deal with it
accordingly.
One
of the things that you might want to look for is what I/O activity
was happening at the time of the error. For example, it is possible
that a disk backup, a DBCC command, or other database activity was
all happening at the same time, overwhelming the disk I/O. Perhaps
the solution to the problem is as simple as rescheduling some
scheduled tasks.
*****
According
to Microsoft, the way to shrink a log file is to use DBCC SHRINKFILE.
This process is painfully slow and inefficient. Even after running
the procedure numerous times, you may not get much free space.
Here’s
another way to shrink your logs that is guaranteed to work every
time. First, back up the database and then detach (sp_detach_db) it
(you will have to bring the database down to do this). Next, delete
the log file and then re-attach (sp_attach_db) the database, not
providing the old log file location from within the sp_attach_db
command. This will create a new log file with the old log file name
in the old location with default size i.e. 512 KB.
To
make sure there is no problem during the operation, the old log file
can be renamed and kept until the database is reattached
successfully. This provides a backup plan if for some reason SQL
server fails to attach the database without the old log file.
This
trick won’t work if the database has more than one log file, but if
you need to, you can alter the database so that it only has a single
log file, while will allow you to perform the above steps. After
carrying out the detach and attach database activity, the database
can be again altered to add more log files. Contributed
by Gaurav Bindlish.
*****
In
SQL Server’s Query Analyzer, a somewhat hidden, but useful feature
exists that you may not be aware off, and that is the Transact-SQL
Debugger. The reasons you may not have seen it before in Query
Analyzer is that you don’t see this option in any standard menu,
making it somewhat hard to find.
To
use the Transact-SQL Debugger, you must first ensure that the Object
Browser is displayed from within Query Analyzer. Next, using the
Object Browser, open up a database that has one or more stored
procedures, then right-click on the stored procedure’s name, and
then select Debug. This is how you turn on debugging for a stored
procedure.
Once
you click on Debug, if the stored procedure you selected has one or
more input parameters, you will be asked to enter them, and then you
can begin the debugging process. The Transact-SQL Debugger has the
typical features you find in most any debugging tool, including:
• Go:
Puts the stored procedure into the debugging mode.
• Toggle
Breakpoint: Sets or removes a breakpoint at the current line in your
code. You cannot set a breakpoint on lines containing non-executable
code.
• Remove All Breakpoints: Clears all the
breakpoints in your code.
• Step Into: Step Into
executes the statement at the current execution point, and then
executes one code statement at a time. If the statement is a call to
another stored procedure, then the next statement displayed is the
first statement in the stored procedure.
• Step Over:
Executes one code statement at a time. If the current statement
contains a call to another stored procedure, Step Over executes the
stored procedure as a unit, and then steps to the next statement in
the current stored procedure.
• Step Out: Executes
the remaining lines of code in which the current execution point
lies. The next statement displayed is the statement following the
procedure call. All of the code is executed between the current and
the final execution points.
• Run to Cursor:
Specifies a statement further down in your code where you want
execution to end.
• Restart: Restarts execution at
the beginning of the stored procedure.
• Stop
Debugging: Stops debugging.
• Watch: Displays the
current watch expressions.
• Callstack: Lists the
procedures calls that have started, but have yet to be
completed.
• Auto Rollback: Automatically rolls back
all work performed during execution of the stored procedure.
*****
Have
you ever wanted to test the latest beta software, but didn’t want
to put it on your “production” desktop because you were afraid it
might crash it, and didn’t have a separate test box available to
run it on? Or have you wanted more than one test environment, but
didn’t have the necessary hardware?
In
both of these cases, there is a new option that allows you to do
both, while not requiring any more hardware. How? By using Microsoft
Virtual PC 2007. This software, which is designed to run on most
desktops and Microsoft operating systems, allows you to install
virtual servers on your current desktop (assuming your hardware is
big enough).
For
example, if you are running Windows XP Workstation on your desktop,
you can create one or more multiple virtual servers that run almost
any other Microsoft operating system, along with your choice of
application software, such as SQL Server running under Windows
Server, or any combination you like.
Virtual
servers don’t have to be active all the time, you can bring them up
only when you want to, helping to preserve hardware resources. You
can create as many virtual servers as you like, plus you can have as
many running as you like, assuming your hardware will handle them.
If
you decide to do this, there are two things you may want to keep in
mind. First, when you create a virtual server, you must specify how
the networking will work. There are several options. You may have to
experiment with these options to select the one that works best for
you. Also, you will want to install the optional Virtual Machine
Additions into your virtual server, after it is built. This will
greatly enhance the performance of the virtual software. Information
on how to do this is available in the instructions.
Microsoft
also offers a “server” version.
*****
To
quickly identify which, if any, of your procedure is executed when
SQL Server starts, you can use the following query:
USE
master
GO
SELECT
name
FROM
sysobjects
WHERE
OBJECTPROPERTY(id,
‘ExecIsStartup’) = 1
However,
you can also get the same result via the INFORMATION_SCHEMA views,
which are generally preferable over directly querying the system
tables. Here’s the query:
USE
master
GO
SELECT
ROUTINE_NAME
FROM
INFORMATION_SCHEMA.ROUTINES
WHERE
OBJECTPROPERTY(OBJECT_ID(ROUTINE_NAME),
‘ExecIsStartUp’) = 1
출처 : http://www.sql-server-performance.com/2007/gen-tips/7/


 Query 17: Get Current Language Id


 Performance_Tuning_Waits_Queues.doc
