Collect and store historical performance counter data using SQL
ServerWritten By: Tim Ford --
12/21/2010 -- read/post comments -- print -- 
Rating:  Rate Rate
Problem
I'd like to capture and store specific SQL Server
performance counters over time, but I don't want to have to set up Performance
Monitor to run on each of my SQL Servers - I have too many, and it would take
too much hands-on-keyboard computer time to put that plan in play. Do you have
any suggestions?
Solution
As a matter of fact I do have a process in mind
that I use in my own organization. It builds upon some of the concepts I have
written about over the years in various tips here at MSSQLTips.com. I am going
to give you a bit of reading homework first since what I will be discussing here
depends upon understanding of running scripts against multiple SQL Server
instances at one time and familiarity with a specific Dynamic Management View:
sys.dm_os_performance_counters. This tip actually builds upon a framework I
outlined in the last tip listed below, but I've improved upon the solution
presented at that time by accomodating named instances and also providing the
code for a SQL Agent Job that will allow for the automatic collection of results
for trending.
Please take a look over the three tips I've previously published on the
subjects of running the same command against multiple instances and on the
sys.dm_os_performance_counters Dynamic Management View:
This process involves three steps, each described separately below.
Step One
Create the Registered Server Group for the SQL Instances you intend to push
this solution. I tend to do this step in three phases:
- Two test instances (one default instance and one named instance – you’ll see
why shortly when we look at the results that are returned for queries against
sys.dm_os_performance_counters for named instances.)
- A group of remaining non-production SQL instances since I intend to push out
the solution and monitor its behavior for a couple days before I push to
production servers.
- The production instances of SQL Server that I intend to run this process for
monitoring.
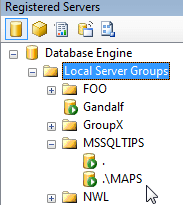
It should be noted that since we’re dealing with Dynamic Management Views
that this solution will only work for SQL Server 2005 and newer. Only for the
purposes of this article have I created the MSSQLTips registered servers group.
It contains two instances: the default instance and the MAPS named instance.
Before proceeding I'd like to show you quickly what to expect when you query
sys.dm_os_performance_counters. If you read the tip I provided above you'll
have a good understanding of what to expect - for the default instance.
However, the results are different for named instances when it comes to the
[object_name] column values. Let's take a look at the results of a simple query
against this DMV for both a default and named instance and you'll see what I
mean, furthermore it will lead you to understand some of the dynamic T/SQL I
employ in the next step when I populate the list of counters I intend to
persist.
SELECT [object_name],
[counter_name], [instance_name],
[cntr_value]

FROM sys.dm_os_performance_counters

WHERE counter_name
= 'Buffer cache
hit ratio';
When run against the default instance the results appear as such:

When run against a named instance you'll see the results differ when it comes
to the object_name column:

You'll see in the next step how I account for the fact that the instance name
is integrated into the object_name value.
Step Two
I utilize a dedicated database on all my SQL Servers to host tables,
views, stored procedures and functions to run in a uniform fashion against all
my SQL Server databases and instances.
Here at MSSQLTips I’ve always referred to it as iDBA (named changed to
protect the innocent DBA.) So, in my
iDBA database (or whatever name you prefer on your SQL Servers) I create the
necessary objects to support the data collection process from
sys.dm_os_performance_counters:
- MetaBOT schema
- MetaBOT.dm_os_performance_counters table – hosts the collected results from
sys.dm_os_performance_counters
- MetaBOT.watched_counters table – hosts the counters that I intend to
collect
USE
[iDBA];

GO


CREATE SCHEMA
MetaBOT AUTHORIZATION dbo;

GO


IF NOT EXISTS (SELECT
name FROM
iDBA.sys.[tables] T WHERE name = 'dm_os_performance_counters')

CREATE TABLE
[MetaBOT].[dm_os_performance_counters]

(

[object_name]
NVARCHAR(128),

[counter_name]
NVARCHAR(128),

[instance_name]
NVARCHAR(128),

[cntr_value]
bigint,

[date_stamp] DATETIME

);


IF NOT EXISTS (SELECT
name FROM
iDBA.sys.[tables] T WHERE name = 'watched_counters')

CREATE TABLE
[iDBA].[MetaBOT].[watched_counters]

(

[object_name]
NVARCHAR(128),

[counter_name]
NVARCHAR(128),

[active]
bit

);


GO
I then populate the MetaBOT.watched_counters table with values and finally
create a stored procedure that I can call from inside a scheduled SQL Server
Agent job to populate the MetaBOT.dm_os_performance_counters table on a
consistent basis. This is where I account for the named instance's impact on
the object_name column by building the value dynamically based upon the core
object name and the instance name as derived from use of the @@SERVICENAME
constant:
--+-- Now populate the watched counters table based upon
instance properties

DECLARE @NamedInstance bit

DECLARE
@ObjectNamePrefix VARCHAR(50)

SELECT @NamedInstance
= 1


IF @@SERVICENAME =
'MSSQLSERVER'

BEGIN

SELECT @NamedInstance =
0  --This is
the default instance


INSERT INTO
[MetaBOT].[watched_counters] ([object_name], [counter_name],
[active])

VALUES ('SQLServer:Buffer
Manager', 'Buffer cache hit ratio',
1);


INSERT INTO
[MetaBOT].[watched_counters] ([object_name], [counter_name],
[active])

VALUES ('SQLServer:Buffer
Manager', 'Buffer cache hit ratio base', 1);


INSERT INTO
[MetaBOT].[watched_counters] ([object_name], [counter_name],
[active])

VALUES ('SQLServer:Buffer
Manager', 'Database pages',
1);


INSERT INTO
[MetaBOT].[watched_counters] ([object_name], [counter_name],
[active])

VALUES ('SQLServer:Buffer
Manager', 'Free
pages', 1);


INSERT INTO [MetaBOT].[watched_counters] ([object_name], [counter_name],
[active])

VALUES ('SQLServer:Buffer
Manager', 'Page
life expectancy', 1);


INSERT INTO [MetaBOT].[watched_counters] ([object_name], [counter_name],
[active])

VALUES ('SQLServer:Buffer
Manager', 'Page
lookups/sec', 1);


INSERT INTO [MetaBOT].[watched_counters] ([object_name], [counter_name],
[active])

VALUES ('SQLServer:Buffer
Manager', 'Page
reads/sec', 1);


INSERT INTO [MetaBOT].[watched_counters] ([object_name], [counter_name],
[active])

VALUES ('SQLServer:Buffer
Manager', 'Page
writes/sec', 1);


INSERT INTO [MetaBOT].[watched_counters] ([object_name], [counter_name],
[active])

VALUES ('SQLServer:Buffer
Manager', 'Reserved pages',
1);


INSERT INTO
[MetaBOT].[watched_counters] ([object_name], [counter_name],
[active])

VALUES ('SQLServer:Buffer
Manager', 'Stolen pages', 1);


INSERT INTO [MetaBOT].[watched_counters] ([object_name], [counter_name],
[active])

VALUES ('SQLServer:Buffer
Manager', 'Target pages', 1);


INSERT INTO [MetaBOT].[watched_counters] ([object_name], [counter_name],
[active])

VALUES ('SQLServer:Buffer
Manager', 'Total pages', 1);


INSERT INTO [MetaBOT].[watched_counters] ([object_name], [counter_name],
[active])

VALUES ('SQLServer:Cursor Manager
by Type', 'Active cursors',
1);


INSERT INTO
[MetaBOT].[watched_counters] ([object_name], [counter_name],
[active])

VALUES ('SQLServer:Databases',
'Active Transactions', 1);


INSERT INTO
[MetaBOT].[watched_counters] ([object_name], [counter_name],
[active])

VALUES ('SQLServer:Databases',
'Data File(s) Size (KB)', 1);


INSERT INTO
[MetaBOT].[watched_counters] ([object_name], [counter_name],
[active])

VALUES ('SQLServer:Databases',
'Log File(s) Size (KB)', 1);


INSERT INTO
[MetaBOT].[watched_counters] ([object_name], [counter_name],
[active])

VALUES ('SQLServer:Databases',
'Log File(s) Used Size (KB)', 1);


INSERT INTO
[MetaBOT].[watched_counters] ([object_name], [counter_name],
[active])

VALUES ('SQLServer:Databases',
'Percent Log Used', 1);


INSERT INTO
[MetaBOT].[watched_counters] ([object_name], [counter_name],
[active])

VALUES ('SQLServer:Databases',
'Transactions/sec', 1);


INSERT INTO
[MetaBOT].[watched_counters] ([object_name], [counter_name],
[active])

VALUES ('SQLServer:Exec
Statistics', 'DTC calls', 1);


INSERT INTO [MetaBOT].[watched_counters] ([object_name], [counter_name],
[active])

VALUES ('SQLServer:Exec
Statistics', 'OLEDB calls', 1);


INSERT INTO [MetaBOT].[watched_counters] ([object_namme],
[counter_name], [active])

VALUES ('SQLServer:General
Statistics', 'Transactions', 1);


INSERT INTO [MetaBOT].[watched_counters] ([object_name], [counter_name],
[active])

VALUES ('SQLServer:General
Statistics', 'User Connections',
1);


INSERT INTO
[MetaBOT].[watched_counters] ([object_name], [counter_name],
[active])

VALUES ('SQLServer:Latches',
'Latch Waits/sec', 1);


INSERT INTO
[MetaBOT].[watched_counters] ([object_name], [counter_name],
[active])

VALUES ('SQLServer:Latches',
'Total Latch Wait Time (ms)', 1);


INSERT INTO
[MetaBOT].[watched_counters] ([object_name], [counter_name],
[active])

VALUES ('SQLServer:Locks',
'Average Wait Time (ms)', 1);


INSERT INTO
[MetaBOT].[watched_counters] ([object_name], [counter_name],
[active])

VALUES ('SQLServer:Locks',
'Lock Wait Time (ms)', 1);


INSERT INTO
[MetaBOT].[watched_counters] ([object_name], [counter_name],
[active])

VALUES ('SQLServer:Memory
Manager', 'Target Server Memory (KB)',
1);


INSERT INTO
[MetaBOT].[watched_counters] ([object_name], [counter_name],
[active])

VALUES ('SQLServer:Memory
Manager', 'Total Server Memory (KB)',
1);


INSERT INTO
[MetaBOT].[watched_counters] ([object_name], [counter_name],
[active])

VALUES ('SQLServer:Plan
Cache', 'Cache
Hit Ratio', 1);


INSERT INTO [MetaBOT].[watched_counters] ([object_name], [counter_name],
[active])

VALUES ('SQLServer:Plan
Cache', 'Cache
Hit Ratio Base', 1);


INSERT INTO [MetaBOT].[watched_counters] ([object_name], [counter_name],
[active])

VALUES ('SQLServer:Plan
Cache', 'Cache
Pages', 1);


INSERT INTO [MetaBOT].[watched_counters] ([object_name], [counter_name],
[active])

VALUES ('SQLServer:SQL
Statistics', 'Batch Requests/sec',
1);


INSERT INTO
[MetaBOT].[watched_counters] ([object_name], [counter_name],
[active])

VALUES ('SQLServer:Transactions',
'Free Space in tempdb (KB)', 1);


INSERT INTO
[MetaBOT].[watched_counters] ([object_name], [counter_name],
[active])

VALUES ('SQLServer:Transactions',
'Longest Transaction Running Time', 1);


INSERT INTO
[MetaBOT].[watched_counters] ([object_name], [counter_name],
[active])

VALUES ('SQLServer:Transactions',
'NonSnapshot Version Transactions', 1);


INSERT INTO
[MetaBOT].[watched_counters] ([object_name], [counter_name],
[active])

VALUES ('SQLServer:Transactions',
'Snapshot Transactions', 1);


INSERT INTO
[MetaBOT].[watched_counters] ([object_name], [counter_name],
[active])

VALUES ('SQLServer:Transactions',
'Transactions',
1);


INSERT INTO
[MetaBOT].[watched_counters] ([object_name], [counter_name],
[active])

VALUES ('SQLServer:Transactions',
'Update Snapshot Transactions', 1);


INSERT INTO
[MetaBOT].[watched_counters] ([object_name], [counter_name],
[active])

VALUES ('SQLServer:Transactions',
'Version Store Size (KB)', 1);


INSERT INTO
[MetaBOT].[watched_counters] ([object_name], [counter_name],
[active])

VALUES ('SQLServer:Wait
Statistics', 'Lock waits', 1);


INSERT INTO [MetaBOT].[watched_counters] ([object_name], [counter_name],
[active])

VALUES ('SQLServer:Wait
Statistics', 'Log buffer waits',
1);


INSERT INTO
[MetaBOT].[watched_counters] ([object_name], [counter_name],
[active])

VALUES ('SQLServer:Wait
Statistics', 'Log write waits',
1);


INSERT INTO
[MetaBOT].[watched_counters] ([object_name], [counter_name],
[active])

VALUES ('SQLServer:Wait
Statistics', 'Memory grant queue waits',
1);


INSERT INTO
[MetaBOT].[watched_counters] ([object_name], [counter_name],
[active])

VALUES ('SQLServer:Wait
Statistics', 'Network IO waits',
1);


INSERT INTO
[MetaBOT].[watched_counters] ([object_name], [counter_name],
[active])

VALUES ('SQLServer:Wait
Statistics', 'Non-Page latch waits',
1);


INSERT INTO
[MetaBOT].[watched_counters] ([object_name], [counter_name],
[active])

VALUES ('SQLServer:Wait
Statistics', 'Page IO latch waits',
1);


INSERT INTO
[MetaBOT].[watched_counters] ([object_name], [counter_name],
[active])

VALUES ('SQLServer:Wait
Statistics', 'Page latch waits',
1);


INSERT INTO
[MetaBOT].[watched_counters] ([object_name], [counter_name],
[active])

VALUES ('SQLServer:Wait
Statistics', 'Thread-safe memory objects waits', 1);


INSERT INTO
[MetaBOT].[watched_counters] ([object_name], [counter_name],
[active])

VALUES ('SQLServer:Wait
Statistics', 'Transaction ownership waits', 1);


INSERT INTO
[MetaBOT].[watched_counters] ([object_name], [counter_name],
[active])

VALUES ('SQLServer:Wait
Statistics', 'Wait for the worker',
1);


INSERT INTO
[MetaBOT].[watched_counters] ([object_name], [counter_name],
[active])

VALUES ('SQLServer:Wait
Statistics', 'Workspace synchronization waits', 1);

END


ELSE


BEGIN

   --Account for named instance
when adding object names to watch

   SELECT
@ObjectNamePrefix = 'MSSQL$' + @@SERVICENAME


   INSERT INTO [MetaBOT].[watched_counters] ([object_name], [counter_name],
[active])

   VALUES (@ObjectNamePrefix
+ ':Buffer
Manager', 'Buffer cache hit ratio',
1);


   INSERT INTO [MetaBOT].[watched_counters] ([object_name], [counter_name],
[active])

   VALUES (@ObjectNamePrefix
+ ':Buffer
Manager', 'Buffer cache hit ratio base', 1);


   INSERT INTO
[MetaBOT].[watched_counters] ([object_name], [counter_name],
[active])

   VALUES (@ObjectNamePrefix
+ ':Buffer
Manager', 'Database pages',
1);


INSERT INTO [MetaBOT].[watched_counters] ([object_name], [counter_name],
[active])

   VALUES (@ObjectNamePrefix
+ ':Buffer
Manager', 'Free
pages', 1);


   INSERT INTO [MetaBOT].[watched_counters] ([object_name], [counter_name],
[active])

   VALUES (@ObjectNamePrefix
+ ':Buffer
Manager', 'Page
life expectancy', 1);


   INSERT INTO [MetaBOT].[watched_counters] ([object_name], [counter_name],
[active])

   VALUES (@ObjectNamePrefix
+ ':Buffer
Manager', 'Page
lookups/sec', 1);


   INSERT INTO [MetaBOT].[watched_counters] ([object_name], [counter_name],
[active])

   VALUES (@ObjectNamePrefix
+ ':Buffer
Manager', 'Page
reads/sec', 1);


   INSERT INTO [MetaBOT].[watched_counters] ([object_name], [counter_name],
[active])

   VALUES (@ObjectNamePrefix
+ ':Buffer
Manager', 'Page
writes/sec', 1);


   INSERT INTO [MetaBOT].[watched_counters] ([object_name], [counter_name],
[active])

   VALUES (@ObjectNamePrefix
+ ':Buffer
Manager', 'Reserved pages',
1);


INSERT INTO [MetaBOT].[watched_counters] ([object_name], [counter_name],
[active])

   VALUES (@ObjectNamePrefix
+ ':Buffer
Manager', 'Stolen pages', 1);


   INSERT INTO [MetaBOT].[watched_counters] ([object_name], [counter_name],
[active])

   VALUES (@ObjectNamePrefix
+ ':Buffer
Manager', 'Target pages', 1);


   INSERT INTO [MetaBOT].[watched_counters] ([object_name], [counter_name],
[active])

   VALUES (@ObjectNamePrefix
+ ':Buffer
Manager', 'Total pages', 1);


   INSERT INTO [MetaBOT].[watched_counters] ([object_name], [counter_name],
[active])

   VALUES (@ObjectNamePrefix
+ ':Cursor
Manager by Type', 'Active cursors',
1);


INSERT INTO [MetaBOT].[watched_counters] ([object_name], [counter_name],
[active])

   VALUES (@ObjectNamePrefix
+ ':Databases', 'Active Transactions',
1);


INSERT INTO [MetaBOT].[watched_counters] ([object_name], [counter_name],
[active])

   VALUES (@ObjectNamePrefix
+ ':Databases', 'Data File(s) Size (KB)',
1);


INSERT INTO [MetaBOT].[watched_counters] ([object_name], [counter_name],
[active])

   VALUES (@ObjectNamePrefix
+ ':Databases', 'Log File(s) Size (KB)',
1);


INSERT INTO [MetaBOT].[watched_counters] ([object_name], [counter_name],
[active])

   VALUES (@ObjectNamePrefix
+ ':Databases', 'Log File(s) Used Size (KB)', 1);


   INSERT INTO
[MetaBOT].[watched_counters] ([object_name], [counter_name],
[active])

   VALUES (@ObjectNamePrefix
+ ':Databases', 'Percent Log Used',
1);


INSERT INTO [MetaBOT].[watched_counters] ([object_name], [counter_name],
[active])

   VALUES (@ObjectNamePrefix
+ ':Databases', 'Transactions/sec',
1);


INSERT INTO [MetaBOT].[watched_counters] ([object_name], [counter_name],
[active])

   VALUES (@ObjectNamePrefix
+ ':Exec
Statistics', 'DTC calls', 1);


   INSERT INTO [MetaBOT].[watched_counters] ([object_name], [counter_name],
[active])

   VALUES (@ObjectNamePrefix
+ ':Exec
Statistics', 'OLEDB calls', 1);


   INSERT INTO [MetaBOT].[watched_counters] ([object_name], [counter_name],
[active])

   VALUES (@ObjectNamePrefix
+ ':General
Statistics', 'Transactions', 1);


   INSERT INTO [MetaBOT].[watched_counters] ([object_name], [counter_name],
[active])

   VALUES (@ObjectNamePrefix
+ ':General
Statistics', 'User Connections',
1);


INSERT INTO [MetaBOT].[watched_counters] ([object_name], [counter_name],
[active])

   VALUES (@ObjectNamePrefix
+ ':Latches', 'Latch Waits/sec',
1);


INSERT INTO [MetaBOT].[watched_counters] ([object_name], [counter_name],
[active])

   VALUES (@ObjectNamePrefix
+ ':Latches', 'Total Latch Wait Time (ms)', 1);


   INSERT INTO
[MetaBOT].[watched_counters] ([object_name], [counter_name],
[active])

   VALUES (@ObjectNamePrefix
+ ':Locks', 'Average Wait Time (ms)',
1);


INSERT INTO [MetaBOT].[watched_counters] ([object_name], [counter_name],
[active])

   VALUES (@ObjectNamePrefix
+ ':Locks', 'Lock Wait Time (ms)',
1);


INSERT INTO [MetaBOT].[watched_counters] ([object_name], [counter_name],
[active])

   VALUES (@ObjectNamePrefix
+ ':Memory
Manager', 'Target Server Memory (KB)',
1);


INSERT INTO [MetaBOT].[watched_counters] ([object_name], [counter_name],
[active])

   VALUES (@ObjectNamePrefix
+ ':Memory
Manager', 'Total Server Memory (KB)',
1);


INSERT INTO [MetaBOT].[watched_counters] ([object_name], [counter_name],
[active])

   VALUES (@ObjectNamePrefix
+ ':Plan
Cache', 'Cache
Hit Ratio', 1);


INSERT INTO [MetaBOT].[watched_counters] ([object_name], [counter_name],
[active])

   VALUES (@ObjectNamePrefix
+ ':Plan
Cache', 'Cache
Hit Ratio Base', 1);


   INSERT INTO [MetaBOT].[watched_counters] ([object_name], [counter_name],
[active])

   VALUES (@ObjectNamePrefix
+ ':Plan
Cache', 'Cache
Pages', 1);


   INSERT INTO [MetaBOT].[watched_counters] ([object_name], [counter_name],
[active])

   VALUES (@ObjectNamePrefix
+ ':SQL
Statistics', 'Batch Requests/sec',
1);


INSERT INTO [MetaBOT].[watched_counters] ([object_name], [counter_name],
[active])

   VALUES (@ObjectNamePrefix
+ ':Transactions',
'Free Space in tempdb (KB)', 1);


   INSERT INTO
[MetaBOT].[watched_counters] ([object_name], [counter_name],
[active])

   VALUES (@ObjectNamePrefix
+ ':Transactions',
'Longest Transaction Running Time', 1);


   INSERT INTO
[MetaBOT].[watched_counters] ([object_name], [counter_name],
[active])

   VALUES (@ObjectNamePrefix
+ ':Transactions',
'NonSnapshot Version Transactions', 1);


   INSERT INTO
[MetaBOT].[watched_counters] ([object_name], [counter_name],
[active])

   VALUES (@ObjectNamePrefix
+ ':Transactions',
'Snapshot Transactions', 1);


   INSERT INTO
[MetaBOT].[watched_counters] ([object_name], [counter_name],
[active])

   VALUES (@ObjectNamePrefix
+ ':Transactions',
'Transactions',
1);


INSERT INTO [MetaBOT].[watched_counters] ([object_name], [counter_name],
[active])

   VALUES (@ObjectNamePrefix
+ ':Transactions',
'Update Snapshot Transactions', 1);


   INSERT INTO
[MetaBOT].[watched_counters] ([object_name], [counter_name],
[active])

   VALUES (@ObjectNamePrefix
+ ':Transactions',
'Version Store Size (KB)', 1);


   INSERT INTO
[MetaBOT].[watched_counters] ([object_name], [counter_name],
[active])

   VALUES (@ObjectNamePrefix
+ ':Wait
Statistics', 'Lock waits', 1);


   INSERT INTO [MetaBOT].[watched_counters] ([object_name], [counter_name],
[active])

   VALUES (@ObjectNamePrefix
+ ':Wait
Statistics', 'Log buffer waits',
1);


INSERT INTO [MetaBOT].[watched_counters] ([object_name], [counter_name],
[active])

   VALUES (@ObjectNamePrefix
+ ':Wait
Statistics', 'Log write waits',
1);


INSERT INTO [MetaBOT].[watched_counters] ([object_name], [counter_name],
[active])

   VALUES (@ObjectNamePrefix
+ ':Wait
Statistics', 'Memory grant queue waits',
1);


INSERT INTO [MetaBOT].[watched_counters] ([object_name], [counter_name],
[active])

   VALUES (@ObjectNamePrefix
+ ':Wait
Statistics', 'Network IO waits',
1);


INSERT INTO [MetaBOT].[watched_counters] ([object_name], [counter_name],
[active])

   VALUES (@ObjectNamePrefix
+ ':Wait
Statistics', 'Non-Page latch waits',
1);


INSERT INTO [MetaBOT].[watched_counters] ([object_name], [counter_name],
[active])

   VALUES (@ObjectNamePrefix
+ ':Wait
Statistics', 'Page IO latch waits',
1);


INSERT INTO [MetaBOT].[watched_counters] ([object_name], [counter_name],
[active])

   VALUES (@ObjectNamePrefix
+ ':Wait
Statistics', 'Page latch waits',
1);


INSERT INTO [MetaBOT].[watched_counters] ([object_name], [counter_name],
[active])

   VALUES (@ObjectNamePrefix
+ ':Wait
Statistics', 'Thread-safe memory objects waits', 1);


   INSERT INTO
[MetaBOT].[watched_counters] ([object_name], [counter_name],
[active])

   VALUES (@ObjectNamePrefix
+ ':Wait
Statistics', 'Transaction ownership waits', 1);


   INSERT INTO
[MetaBOT].[watched_counters] ([object_name], [counter_name],
[active])

   VALUES (@ObjectNamePrefix
+ ':Wait
Statistics', 'Wait for the worker',
1);


INSERT INTO [MetaBOT].[watched_counters] ([object_name], [counter_name],
[active])

   VALUES (@ObjectNamePrefix
+ ':Wait
Statistics', 'Workspace synchronization waits', 1);

END
You may note that I track quite a few counters here - I figure if I go
through the effort of setting this up then I may as well capture too much than
not enough. Depending upon your environment and the number of databases you're
hosting you may wish to persist fewer counters. Some of these counters exist in
a 1:1 relationship to your database count. I did calculations based upon my
most-populous instance and determined that each row of data persisted averaged
232 bytes; from there I then looked at how frequently I ran the associated
collection job impacted the amount of data I was storing. Running the
collection process every 10 minutes was estimated to yeild 1.5 gb/month.
Increasing the frequency to every two minutes meant increasing the storage
required to 8 gb/month - and this was for a single instance.
Now it's time to create the stored procedure that you'll call from inside
that SQL Server Agent job. It is a simple INSERT statement from
sys.dm_os_performance_counters filtered through an INNER JOIN against the
MetaBOT.watched_counters table we created and populated in the last step. I
didn't bother with creating any indexes in that table as it is so small that the
optimizer would choose to scan the table instead of using the index. The
maintance overhead of an unused index is unwarranted.
CREATE PROCEDURE MetaBOT.usp_collect_perfmon_counters AS

DECLARE @datestamp
DATETIME

SELECT @datestamp =
GETDATE()

INSERT INTO
MetaBOT.[dm_os_performance_counters]


(

        [object_name],


[counter_name],

        [instance_name],

        [cntr_value],


[date_stamp]

  )

  SELECT


DOPC.[object_name],

      DOPC.[counter_name],

      DOPC.[instance_name],

      DOPC.[cntr_value],


@datestamp

  FROM  sys.[dm_os_performance_counters] DOPC

      INNER JOIN iDBA.[MetaBOT].[watched_counters] WC

      ON [DOPC].[object_name]
= [WC].[object_name]

    AND [DOPC].[counter_name]
= [WC].[counter_name]

  ORDER BY [object_name],
[counter_name];
Step Three
The final step involves creating the actual job to run on each instance for
collection of counter values.
What I find easiset to do when coding SQL Agent Job creation is to build the
job in the SQL Server Mangement Studio GUI and then script it out. That is what
I did here. There is one change you need to make when doing this however - you
must either remove or comment-out the line of code that presents the job_id GUID
for output. It's not needed and will cause the script to fail across all but
the initial instance when run. There is a single variable in this code that
allows you to set how frequently the job runs (@RunEveryXMinutes); set the value
equal to the number of minutes you want to expire between job runs.
USE
[msdb]

GO

      /****** Object:  Job
[Metadata_Collect_SQL_Perfmon_Counters]    Script Date: 12/09/2010 12:14:38
******/

  BEGIN TRANSACTION

  DECLARE
@ReturnCode INT

  DECLARE @RunEveryXMinutes TINYINT

  SELECT
@ReturnCode = 0

  SELECT @RunEveryXMinutes
= 10

        /******
Object:  JobCategory [Tuning and Optimization]    Script Date: 12/09/2010
12:14:39 ******/

  IF NOT EXISTS (

    SELECT
name

      FROM msdb.dbo.syscategories

      WHERE name=N'Tuning and Optimization'


        AND category_class=1)

    BEGIN

    EXEC
@ReturnCode = msdb.dbo.sp_add_category @class=N'JOB', @type=N'LOCAL', @name=N'Tuning and Optimization'

    IF (@@ERROR <>
0

          OR @ReturnCode
<> 0) GOTO QuitWithRollback

      END

  DECLARE @jobId
BINARY(16)

  EXEC @ReturnCode =
msdb.dbo.sp_add_job @job_name=N'Metadata_Collect_SQL_Perfmon_Counters',

    @enabled=1,

    @notify_level_eventlog=0,

    @notify_level_email=0,

    @notify_level_netsend=0,

    @notify_level_page=0,

    @delete_level=0,

    @description=N'Poll and store output
from sys.dm_os_performance_counters',


@category_name=N'Tuning and
Optimization',

    @owner_login_name=N'SPECTRUM-HEALTH\svcSQLNotify', @job_id = @jobId OUTPUT

  IF
(@@ERROR
<> 0


          OR @ReturnCode <>
0)
GOTO QuitWithRollback

          /****** Object:  Step [Collect Metadata]    Script Date:
12/09/2010 12:14:39 ******/

    EXEC
@ReturnCode = msdb.dbo.sp_add_jobstep @job_id=@jobId, @step_name=N'Collect Metadata',


@step_id=1,

    @cmdexec_success_code=0,

    @on_success_action=1,

    @on_success_step_id=0,

    @on_fail_action=2,

    @on_fail_step_id=0,

    @retry_attempts=0,

    @retry_interval=0,

    @os_run_priority=0, @subsystem=N'TSQL',

    @command=N'EXEC MetaBOT.usp_collect_perfmon_counters;',

    @database_name=N'iDBA',

    @flags=0

  IF (@@ERROR <> 0


OR @ReturnCode <>
0)
GOTO QuitWithRollback

    EXEC @ReturnCode
= msdb.dbo.sp_update_job
@job_id =
@jobId,
@start_step_id = 1

  IF (@@ERROR <>
0

        OR @ReturnCode
<> 0) GOTO QuitWithRollback

    EXEC @ReturnCode
= msdb.dbo.sp_add_jobschedule @job_id=@jobId, @name=N'dm_os_perfmon_counters Job',

    @enabled=1,

    @freq_type=4,

    @freq_interval=1,

    @freq_subday_type=4,

    @freq_subday_interval=@RunEveryXMinutes,

    @freq_relative_interval=0,

    @freq_recurrence_factor=0,

    @active_start_date=20101209,

    @active_end_date=99991231,

    @active_start_time=30,

    @active_end_time=235959


--
,@schedule_uid=N'519325e6-3114-453c-bfeb-6597300a45d2' <---Comment this line
out of auto-generated script

  IF
(@@ERROR
<> 0


        OR @ReturnCode <>
0)
GOTO QuitWithRollback

    EXEC @ReturnCode
= msdb.dbo.sp_add_jobserver @job_id = @jobId, @server_name =
N'(local)'

  IF (@@ERROR <>
0

        OR @ReturnCode
<> 0) GOTO QuitWithRollback

    COMMIT TRANSACTION

        GOTO EndSave

        QuitWithRollback:

  IF (@@TRANCOUNT >
0)


ROLLBACK TRANSACTION

        EndSave:

GO
Once activated it's just the matter of querying the persisted values in the
MetaBOT.dm_os_performance_counters table. I also recommend that you set up a
purge command, this can be done as part of the
MetaBOT.usp_collect_perfmon_counters stored procedure as a DELETE from the
MetaBOT.dm_os_performance_counters table where the date_stamp column is less
than whatever threshold you want to set. Depending upon your needs I would also
recommend creating an index on that column if your performance reviews warrant
doing so.
In the next tip of this series I'll examine different ways to disect this
data and use it for analysis for such things as consolidation planning or
reviewing for good people doing bad things in your databases. (Think CURSORS!
folks!)
Next Steps
- Stay tuned for another tip in this series in which I examine how I use this
information to work towards a consolidation plan.
- Previous tips in this series are available here:
- Additional tips on Retaining Historical Index Usage Stats from the Dynamic
Management Views are available at MSSQLTips.
Readers Who Read This Tip Also Read
Free Live
Webcast
Comment or Ask Questions About This
Tip
|